
AUD/USD Price Prediction: Weekly chart shows bearish Tweezer Top nearly confirmed
- AUD/USD rose to the top of its long-term range, formed a bearish Tweezer Top and has weakened.
- This is a bearish sign that suggests a reversal down is set to unfold.
AUD/USD rose up to the top of its range during the summer in a three-wave ABC pattern (see chart) and then formed a bearish Tweezer Top Japanese candlestick reversal pattern on the weekly chart (orange-shaded circled on chart).
AUD/USD Weekly Chart
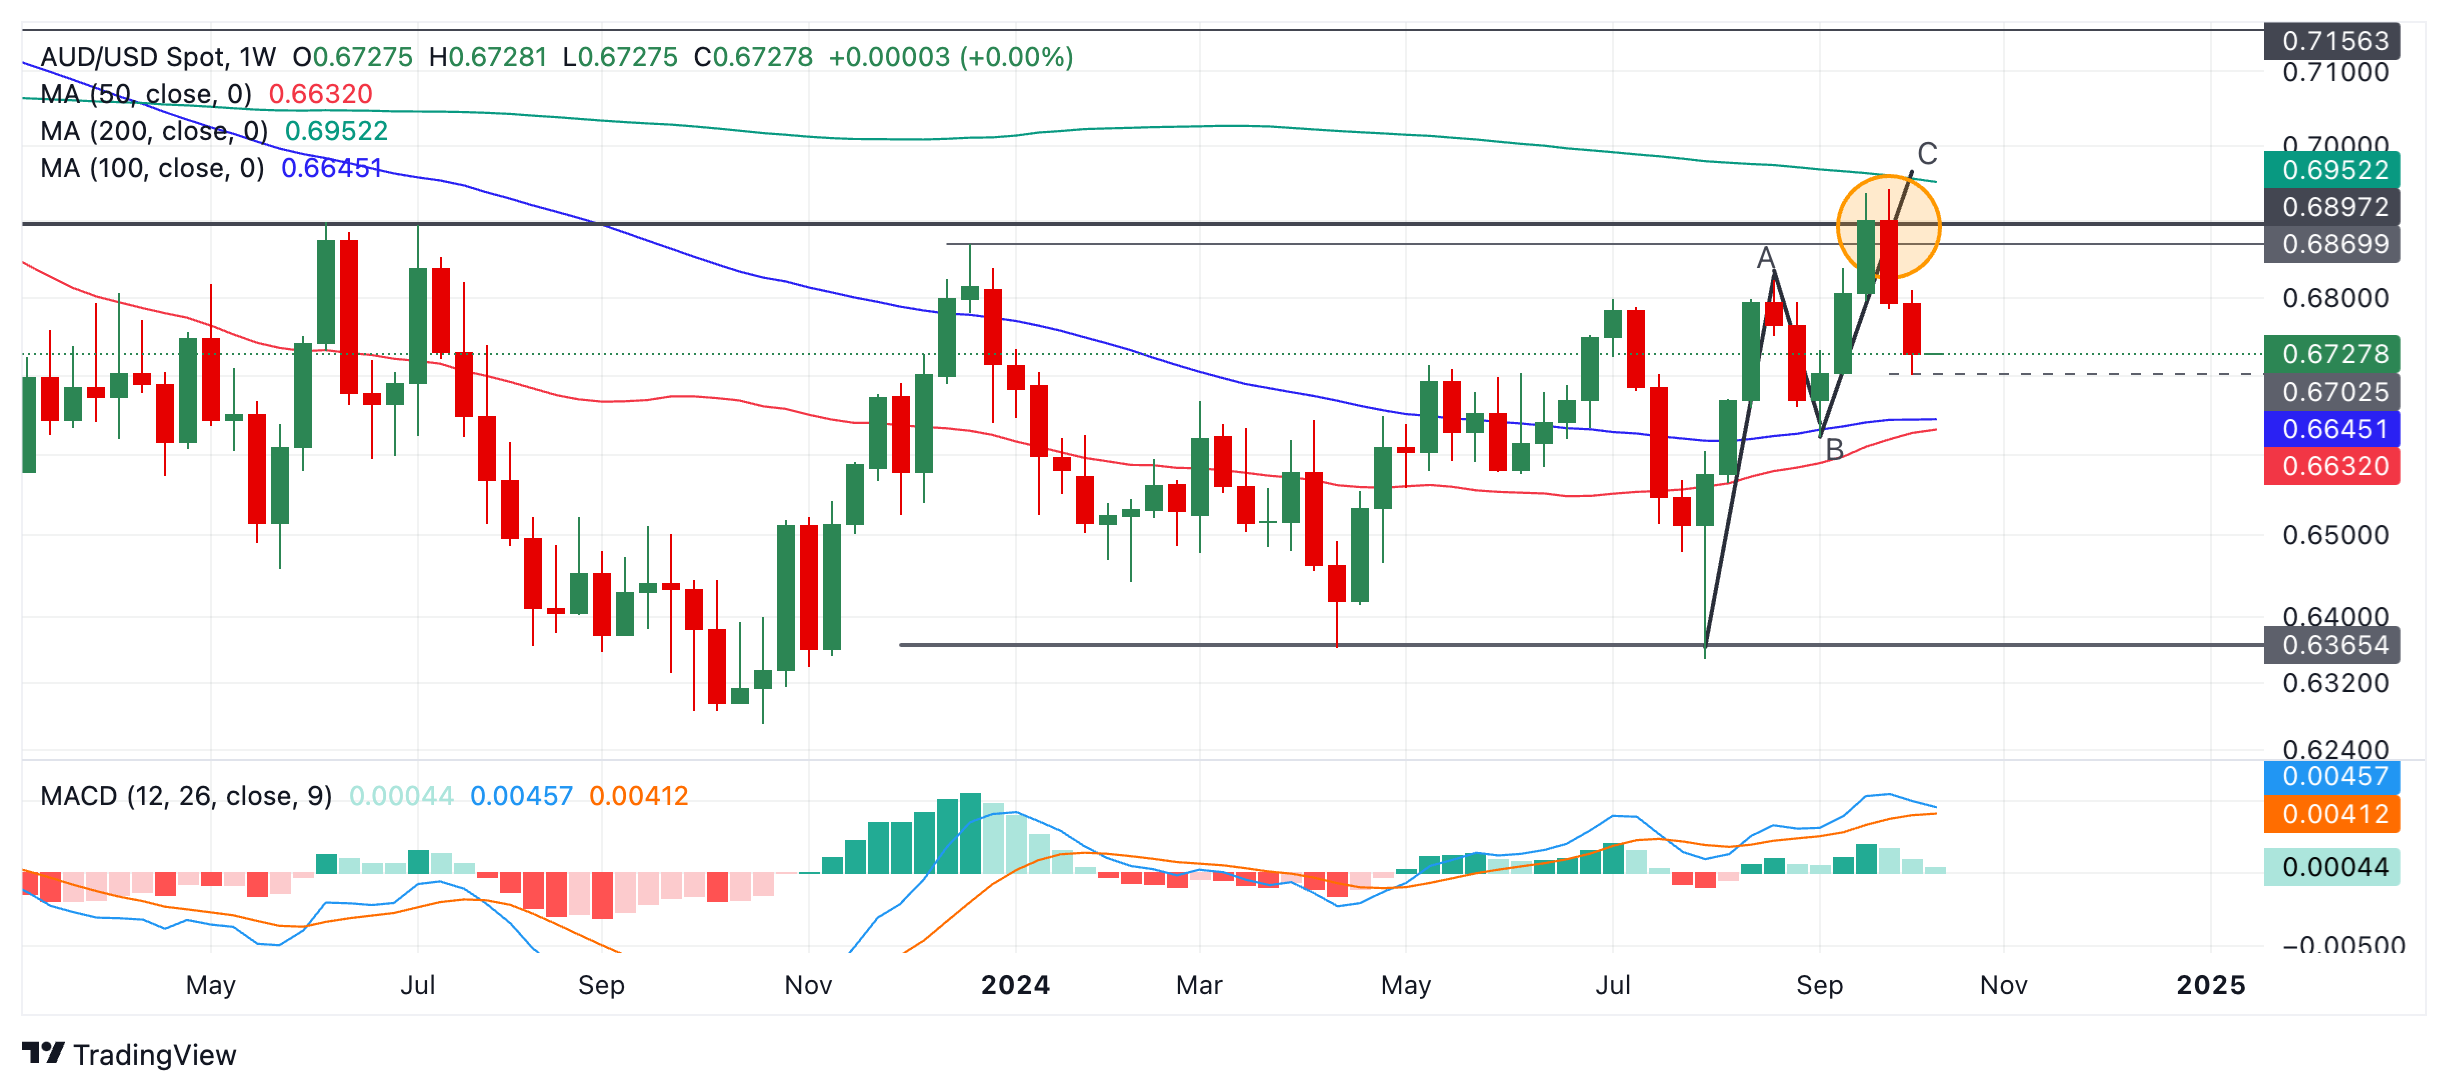
This pattern occurs at the end of an up move when two consecutive bars peak at the same or a similar level and both have a similar length “wick”. The wick is the range that sticks out above the full body of the candle. The two candlest taken together thus resemble a “tweezer”.
In the following week the pair has sold off, so far, and assuming the week ends as a red down candlestick (today is Friday), it will provide added bearish confirmation for the Tweezer Top.
The long-term trend is sideways since the pair has been moving in a range for over a year. Given the principle that “the trend is your friend” the odds favor a continuation of this trend. In this case, this would imply the next move ought to be a down leg back towards the range floor.
A break below 0.6701 (week’s lows) would provide bearish confirmation to an initial target at the cluster of major moving averages at between 0.6645 and 0.6632.
A further break below the bottom of wave B at 0.6622 would probably signal an even deeper sell-off down to a target at 0.6400 and the range lows.
Forex News
Keep up with the financial markets, know what's happening and what is affecting the markets with our latest market updates. Analyze market movers, trends and build your trading strategies accordingly.