
USD/CAD Price Analysis: Holds position above 1.3750 amid resurging bullish sentiment
- USD/CAD may continue to advance as technical analysis suggests a resurgence of bullish sentiment.
- A break above the 1.3800 level might propel the pair to revisit its five-month high of 1.3846.
- The pair could find support around the psychological level of 1.3700 and the 23.6% Fibonacci retracement level of 1.3688.
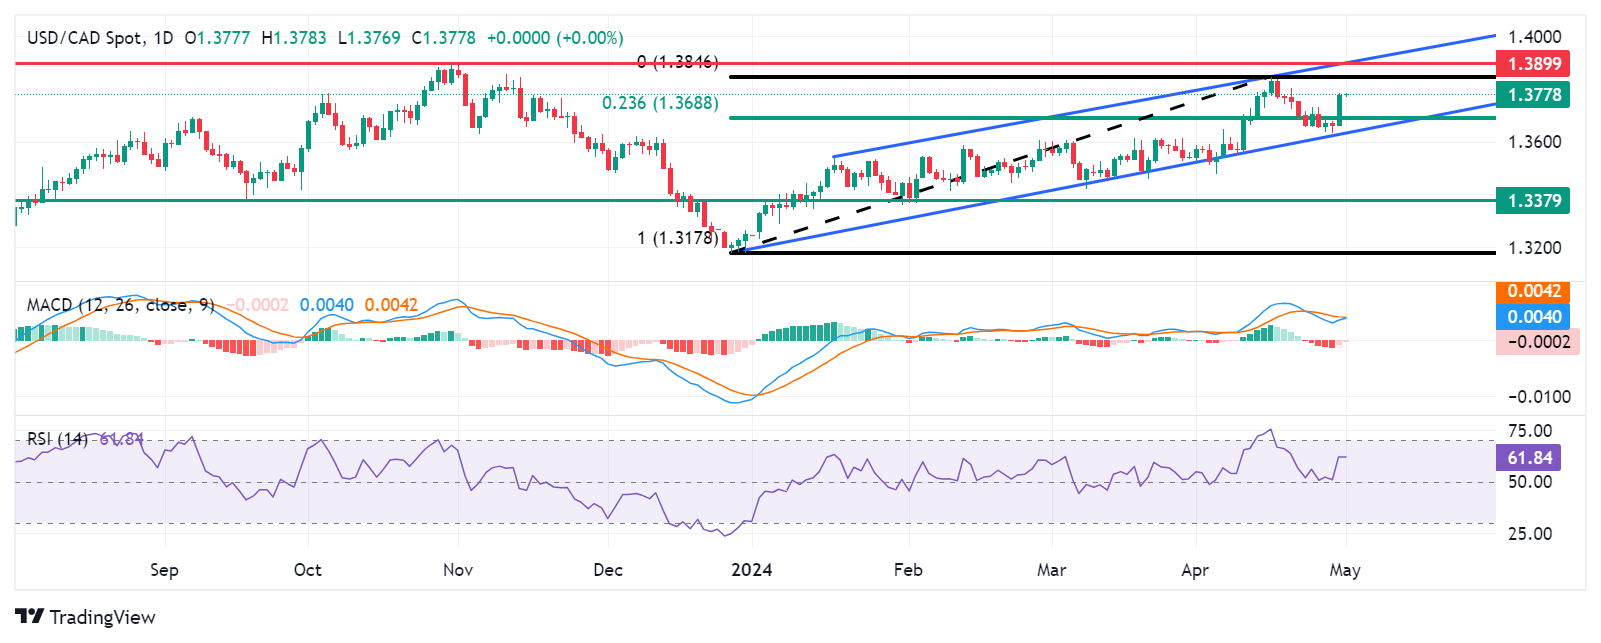
USD/CAD trades around 1.3780 during the early European hours on Wednesday, hovering within an ascending channel on the daily chart. The 14-day Relative Strength Index (RSI) also positioned above 50, indicating a resurgence of bullish sentiment.
Additionally, the Moving Average Convergence Divergence (MACD) line is above the centerline, suggesting bullish momentum, although it remains below the signal line. Traders might seek confirmation from the MACD, a lagging indicator, to validate the trend direction.
The USD/CAD pair could encounter resistance around the psychological level of 1.3800. If it surpasses this level, it may revisit its five-month high of 1.3846, followed by the upper boundary of the ascending channel near 1.3899, the highest level not seen since November.
Conversely, on the downside, the USD/CAD pair could navigate the region around the psychological level of 1.3700, followed by the 23.6% Fibonacci retracement level of 1.3688, which is drawn between the levels of 1.3178 and 1.3846. A break below this level could lead the pair to test the lower boundary of the channel around the 1.3640 level.
USD/CAD: Daily Chart
Forex News
Keep up with the financial markets, know what's happening and what is affecting the markets with our latest market updates. Analyze market movers, trends and build your trading strategies accordingly.