
Gold off session's low on Wednesday with GDP in contraction
- Gold price retraces losses on Wednesday after US GDP turns negative.
- Traders sent Gold initially lower after President Trump signed an order to ease tariffs on car parts.
- Both daily resistances and supports for Gold are narrowing, signaling the increasing chances of a breakout, from a technical point of view.
Gold price (XAU/USD) is recovering from incurred losses and trades around $3,288 on Wednesday after the US Gross Domestic Product and Personal Consumption Expenditures (PCE). Bullion is facing a second day of some profit taking after United States (US) President Donald Trump signed an executive order to ease tariffs on car parts, as the President pointed out the progress in trade negotiations, Bloomberg reported. With more signs that trade tensions are diminishing, the Gold rally looks to be fading.
The negative print in the first preliminary reading of the GDP at -0.3% will be one of the key data points the Federal Reserve will look at when deciding what to do on May 7 regarding interest rates. That same Fed and its chairman, Jerome Powell, got called out again by Trump overnight, saying he knows far more about interest rates than Powell and that he is not doing a good job, Bloomberg reported.
Daily digest market movers: Recession fears up again
- Investors rattled by the growing global trade war flocked to gold-backed exchange-traded funds in the first quarter, with inflows propelling bullion’s 19% rally in the three-month period, according to the World Gold Council. Investors added about 227 tons of bullion to Gold ETFs in the first quarter, the most since 2022, helping prices to increase to fresh record highs, Reuters reports.
- Indian jewelry sales slumped in March compared to the same month last year, and are expected to decline by up to 11% during the fiscal year through March 2026, Bloomberg reports.
- The preliminary reading of the first quarter for US Gross Domestic Product came in at a surprise -0.3%, missing the expected annualized rate of 0.4%, much slower than the 2.4% expansion seen in 2024’s fourth quarter.
- The monthly PCE data for March has been released as well at 14:00 GMT. The Monthly Core PCE is expected to come in at 0.1%, down from 0.4%. The monthly headline number is expected to fall to 0%, from 0.3% previously.
Gold Price Technical Analysis: Not there yet
With the reprieve in tariff stress following Trump’s easing some auto tariffs, odds for a breakout to the downside in the Bullion looks likely. However, the US data could play a crucial role here, for example in case the US GDP numbers show a contraction. Should Trump have a change of heart again and issue more surprise tariffs for example, a boost in Gold would be inevitable.
The daily Pivot Point at $3,322 is the first level that needs to be reclaimed on the upside. From there, the next level to watch out for on the upside is $3,344, the R1 resistance. The R2 resistance at $3,370 is for now the guard keeper on the upside to try and reject Gold price to re-enter above $3,400.
On the downside, the S1 support is providing a cushion at $3,295. Further down, the technical pivotal floor near $3,245 (April 11 high) comes into play.
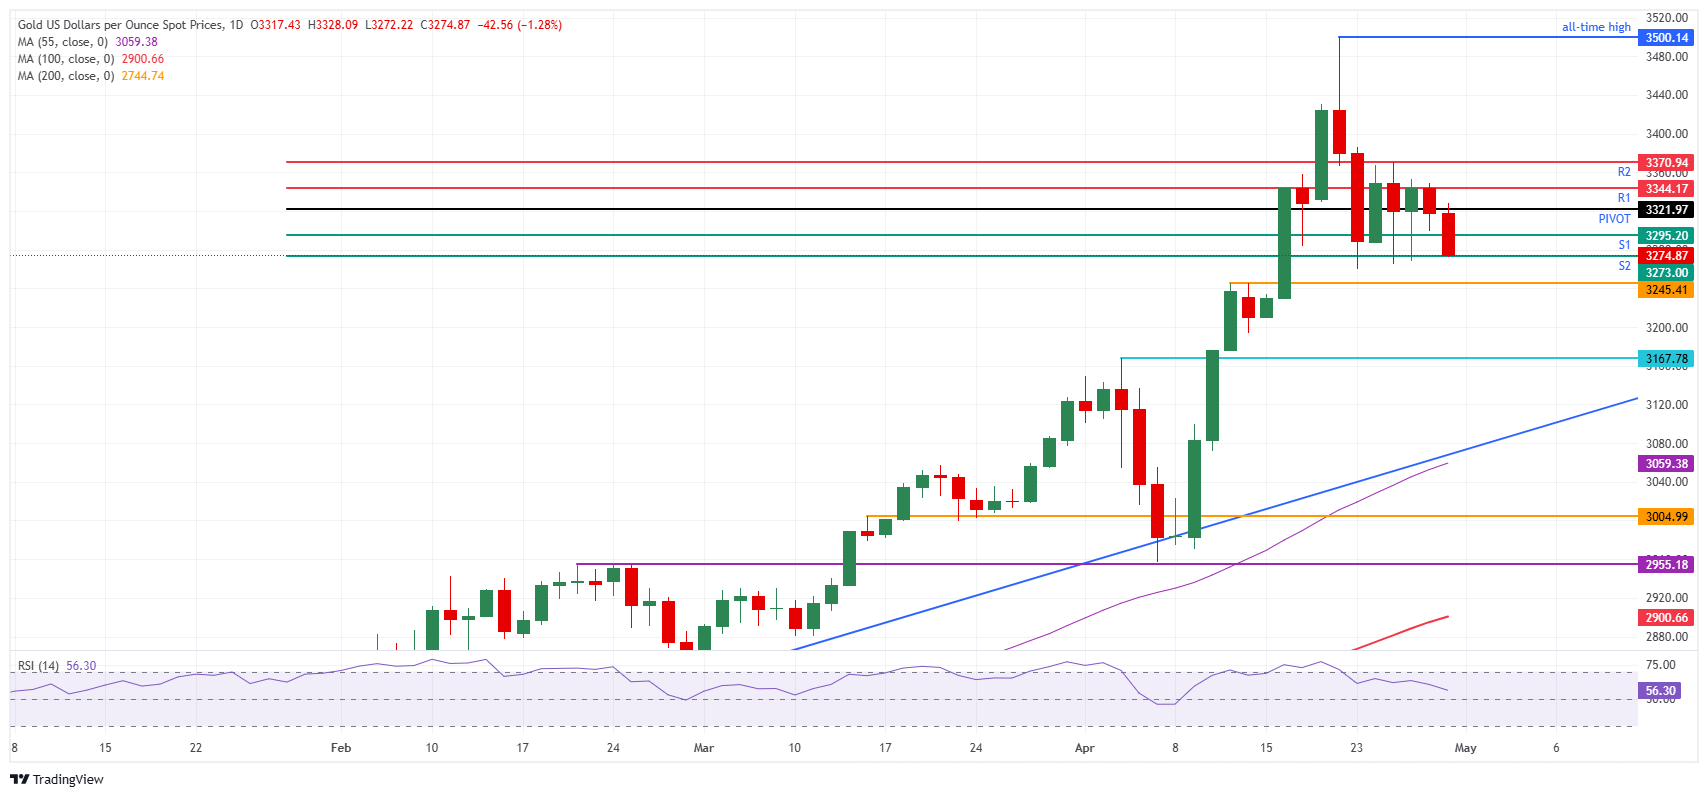
XAU/USD: Daily Chart
GDP FAQs
A country’s Gross Domestic Product (GDP) measures the rate of growth of its economy over a given period of time, usually a quarter. The most reliable figures are those that compare GDP to the previous quarter e.g Q2 of 2023 vs Q1 of 2023, or to the same period in the previous year, e.g Q2 of 2023 vs Q2 of 2022. Annualized quarterly GDP figures extrapolate the growth rate of the quarter as if it were constant for the rest of the year. These can be misleading, however, if temporary shocks impact growth in one quarter but are unlikely to last all year – such as happened in the first quarter of 2020 at the outbreak of the covid pandemic, when growth plummeted.
A higher GDP result is generally positive for a nation’s currency as it reflects a growing economy, which is more likely to produce goods and services that can be exported, as well as attracting higher foreign investment. By the same token, when GDP falls it is usually negative for the currency. When an economy grows people tend to spend more, which leads to inflation. The country’s central bank then has to put up interest rates to combat the inflation with the side effect of attracting more capital inflows from global investors, thus helping the local currency appreciate.
When an economy grows and GDP is rising, people tend to spend more which leads to inflation. The country’s central bank then has to put up interest rates to combat the inflation. Higher interest rates are negative for Gold because they increase the opportunity-cost of holding Gold versus placing the money in a cash deposit account. Therefore, a higher GDP growth rate is usually a bearish factor for Gold price.
BRANDED CONTENT
Not all brokers provide the same benefits for Gold trading, making it essential to compare key features. Knowing each broker’s strengths will help you find the ideal fit for your trading strategy. Explore our detailed guide on the best Gold brokers.
Forex News
Keep up with the financial markets, know what's happening and what is affecting the markets with our latest market updates. Analyze market movers, trends and build your trading strategies accordingly.