
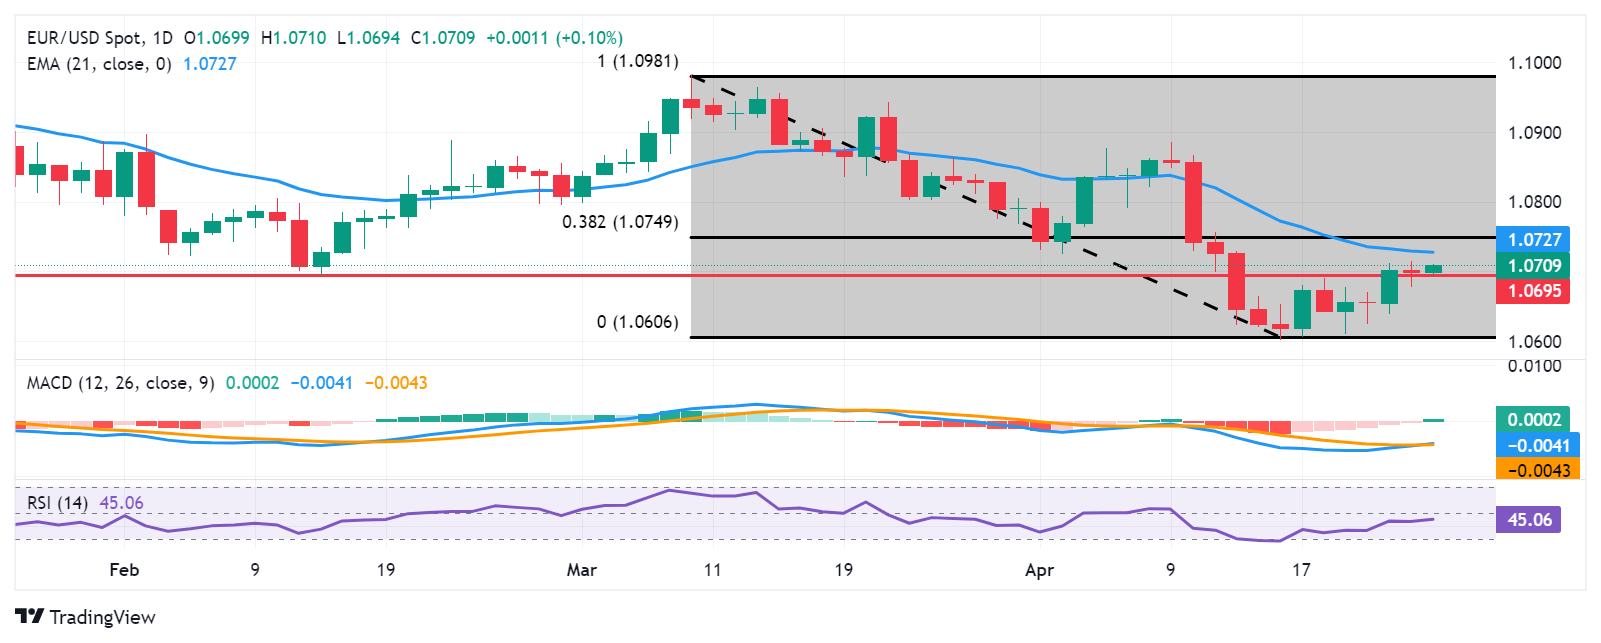
EUR/USD Price Analysis: Moves above 1.0700, next barrier at 21-day EMA
- EUR/USD could approach the 21-day EMA at 1.0727.
- A break below 1.0700 could lead the pair toward the major support of 1.0650 and April’s low at 1.0601.
- A breach above the major level of 1.0695 suggests a weakening of bearish sentiment.
EUR/USD recovers its recent losses registered in the previous session, trading around 1.0710 during the Asian session on Thursday. From a technical standpoint, analysis suggests a weakening of bearish sentiment for the pair as it has surpassed the major level of 1.0695 and the psychological level of 1.0700.
Additionally, the lagging indicator Moving Average Convergence Divergence (MACD) indicates a shift in momentum for the EUR/USD pair, as it is positioned below the centerline but above the signal line. However, the 14-day Relative Strength Index (RSI) remains below the 50-mark, indicating a continuation of bearish momentum.
Key support for the EUR/USD pair is likely to be found around the psychological level of 1.0700. A breach below this level could apply downward pressure on the pair, potentially leading it toward the region surrounding the major support level of 1.0650. Further support may be identified around April’s low at 1.0601, which aligns with the psychological level of 1.0600.
On the upside, the immediate barrier for the pair could be the 21-day Exponential Moving Average (EMA) at 1.0727. A breakthrough above this level could propel the pair towards the 38.2% Fibonacci retracement level at 1.0749, which is drawn between the levels of 1.0981 and 1.0606, coinciding with the major level of 1.0750.
EUR/USD: Daily Chart
Forex News
Keep up with the financial markets, know what's happening and what is affecting the markets with our latest market updates. Analyze market movers, trends and build your trading strategies accordingly.


