Silver Price Analysis: XAG/USD eyes $21.00 amid bearish signals
- Silver prices nosedive 1.8% as they breach crucial support, with sights set on $21.00.
- XAG/USD’s bearish momentum strengthens after falling below the 200-day EMA.
- Recouping 200-day EMA could lead to stabilized trading activity.
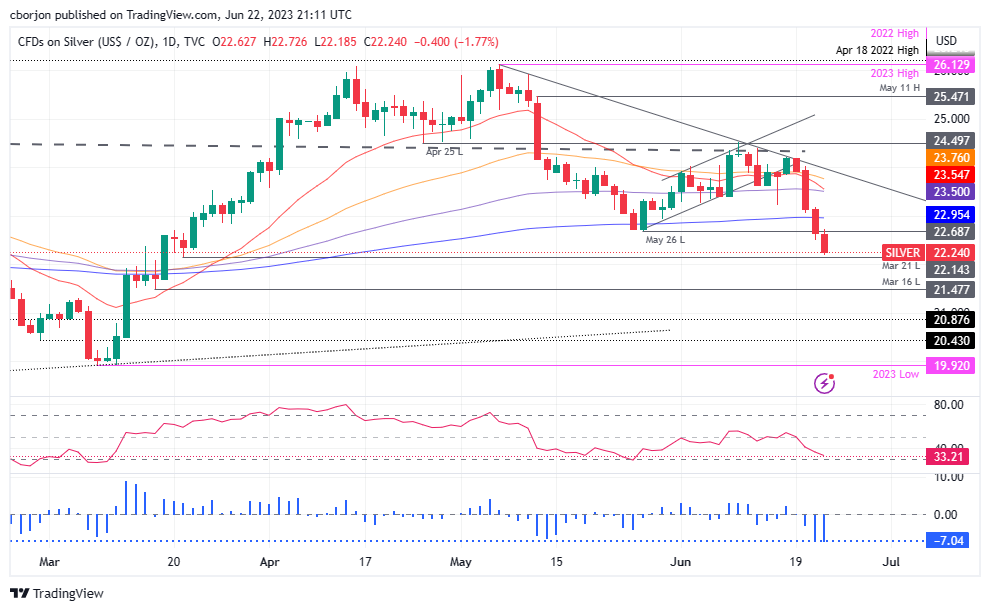
Silver price plunges past the May 26 daily low support at $22.68, extending its losses towards the $22.20 area with sellers eyeing the $21.00 handle. Therefore, XAG/USD Is trading at $22.23, down by 1.80% after hitting a daily high of $22.72, slightly below the 200-day Exponential Moving Average (EMA)
XAG/USD Price Analysis: Technical outlook
Given the backdrop, XAG/USD’s turned bearish after falling below the 200-day EMA and below the prior’s market structure swing low of May 26. The Relative Strength Index (RSI) indicator is also still in bearish territory. At the same time, the three-day Rate of Change (RoC) has printed its lowest level since the beginning of February 3, after the 4.69% plunge that began the snowball fall of Silver prices toward the lowest price of the year, at $19.92.
The XAG/USD first support would be the $22.00 figure. A breach of the latter will expose the March 16 swing low of $21.47, followed by the March 10 daily high at $20.78. Once cleared, the next test would be the year-to-date (YTD) low of $19.92.
Conversely, if XAG/USD buyers stepped in and claimed the 200-day EMA, that could pave the way for sideways price action.
XAG/USD Price Action – Daily chart
Forex News
Keep up with the financial markets, know what's happening and what is affecting the markets with our latest market updates. Analyze market movers, trends and build your trading strategies accordingly.