
NZD/USD Price Analysis: Struggles to counter 0.6000
- NZD/USD faces selling pressure above 0.6000 as US Dollar recovers.
- Fed Kashkari doesn’t see interest rate cuts this year.
- Investors see the RBNZ reducing interest rates from October.
The NZD/USD pair faces pressure above the psychological figure of 0.6000 in Wednesday’s New York session. Downside pressure on the Kiwi asset is driven by risk-averse market sentiment and a recovery in the US Dollar.
The S&P 500 opens on a bearish note, suggesting a weak risk-appetite of investors. 10-year US Treasury yields recover to 4.49% as Minneapolis Federal Reserve (Fed) Bank President Neel Kashkari sounded hawkish in his commentary over the interest rate guidance on Tuesday. The US Dollar Index (DXY) holds strength near intraday’s high around 105.50
Neel Kashkari emphasized the need to keep interest rates at their current levels for the entire year. Kashkari wants to see multiple positive inflation readings to build confidence that inflation is on course to return to the desired rate of 2%.
The New Zealand Dollar has posted a modest decline as investors see the Reserve Bank of New Zealand (RBNZ) shifting to interest rate cuts from the October meeting. Earlier, investors anticipated that the RBNZ would look for rate cuts in 2025.
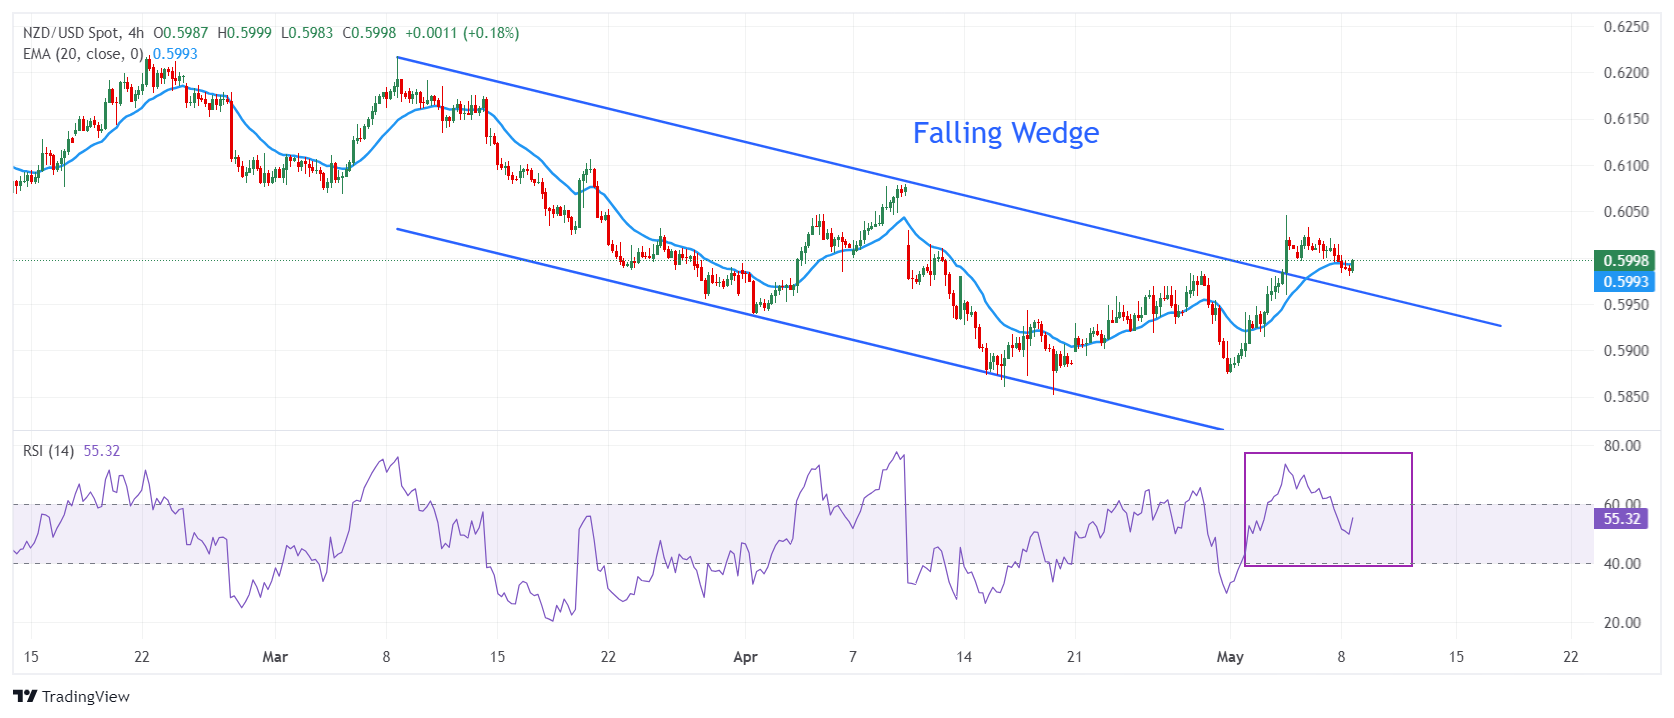
NZD/USD holds gains posted after a breakout of the Falling Wedge formation on a four-hour timeframe. A breakout of the above-mentioned chart pattern exhibits a bullish reversal. The 20-period Exponential Moving Average (EMA) near 0.6000 continues to offer support to the New Zealand Dollar bulls.
The 14-period Relative Strength Index (RSI) hovers inside the 40.00-60.00 range. A decisive break above 60.00 will trigger a bullish momentum.
An upside above April 4 high around 0.6050 will drive the asset towards the round-level resistance of 0.6100 and February 9 high of 0.6160.
On the contrary, a fresh downside would appear if the asset breaks below the April 16 low at 0.5860. This would drag the asset toward 8 September 2023 low at 0.5847, followed by the round-level support of 0.5900.
NZD/USD four-hour chart
Forex News
Keep up with the financial markets, know what's happening and what is affecting the markets with our latest market updates. Analyze market movers, trends and build your trading strategies accordingly.