
Gold Price Analysis: XAU/USD needs to break above $1,771 to extend rally – Confluence Detector
- Gold has surged in tandem with the dollar's broad retreat.
- The Confluence Detector is showing XAU/USD faces resistance at $1,771.
- Gold is not a dream risk-off hedge, nor is Bitcoin [Video]
Stocks go up, stocks go down – and gold remains highly correlated to the fluctuations in the dollar. The broad market mood has worsened amid fears of Sino-American trade tensions, supply issues and soaring energy prices. However, the precious metal seems to have lost its correlation with the risk-on/risk-off flows.
How is XAU/USD positioned after this turbulence?
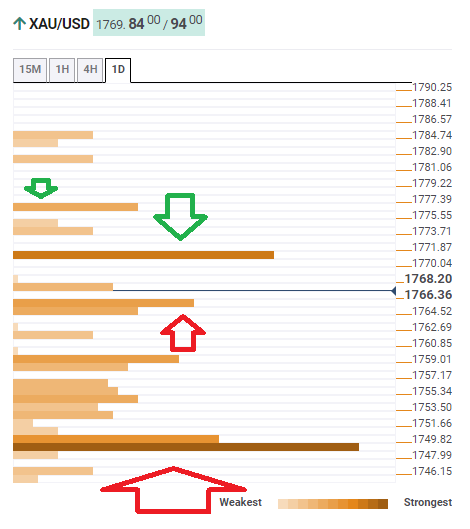
The Technical Confluences Detector is showing that gold's next barrier is $1,771, which is where the Bollinger Band one-day Middle and the Pivot Point one-day Resistance 2 converge.
Above $1,771, which is a significant resistance line, the next soft cap to watch is $1,776, which is where the PP one-week R1 and the BB 4h-Upper meet up.
Some support awaits at $1,765, which is the confluence of the Fibonacci 38.2% one month and the previous day's high.
Further down, a considerable cushion awaits at $1,748, which is a juncture including the Fibonacci 38.2% one-week, the Fibonacci 23.6% one-month, and the BB 1h-Lower.
XAU/USD resistance and support levels
Confluence Detector
The Confluence Detector finds exciting opportunities using Technical Confluences. The TC is a tool to locate and point out those price levels where there is a congestion of indicators, moving averages, Fibonacci levels, Pivot Points, etc. Knowing where these congestion points are located is very useful for the trader, and can be used as a basis for different strategies.
Learn more about Technical Confluence
Forex News
Keep up with the financial markets, know what's happening and what is affecting the markets with our latest market updates. Analyze market movers, trends and build your trading strategies accordingly.