
EUR/JPY Price Analysis: Bulls maintain the reign and step over the bears
- Indicators on the daily chart show a consistent rise in bullish momentum.
- On the hourly chart, the RSI reflects a more volatile picture with general positivity, yet the MACD shows a lack of sustained buying traction.
The EUR/JPY pair continues to exhibit strong momentum, displaying gains of 0.55% on Wednesday. With buyers maintaining dominance, the pair remains steadfast above its key Simple Moving Averages (SMAs) in both the short and long term, indicating the potential for a further upward move. The latest downward movements may have been only corrective as bears lacked the conviction to hold the pair below the 20-day SMA and buyers recovered ground.
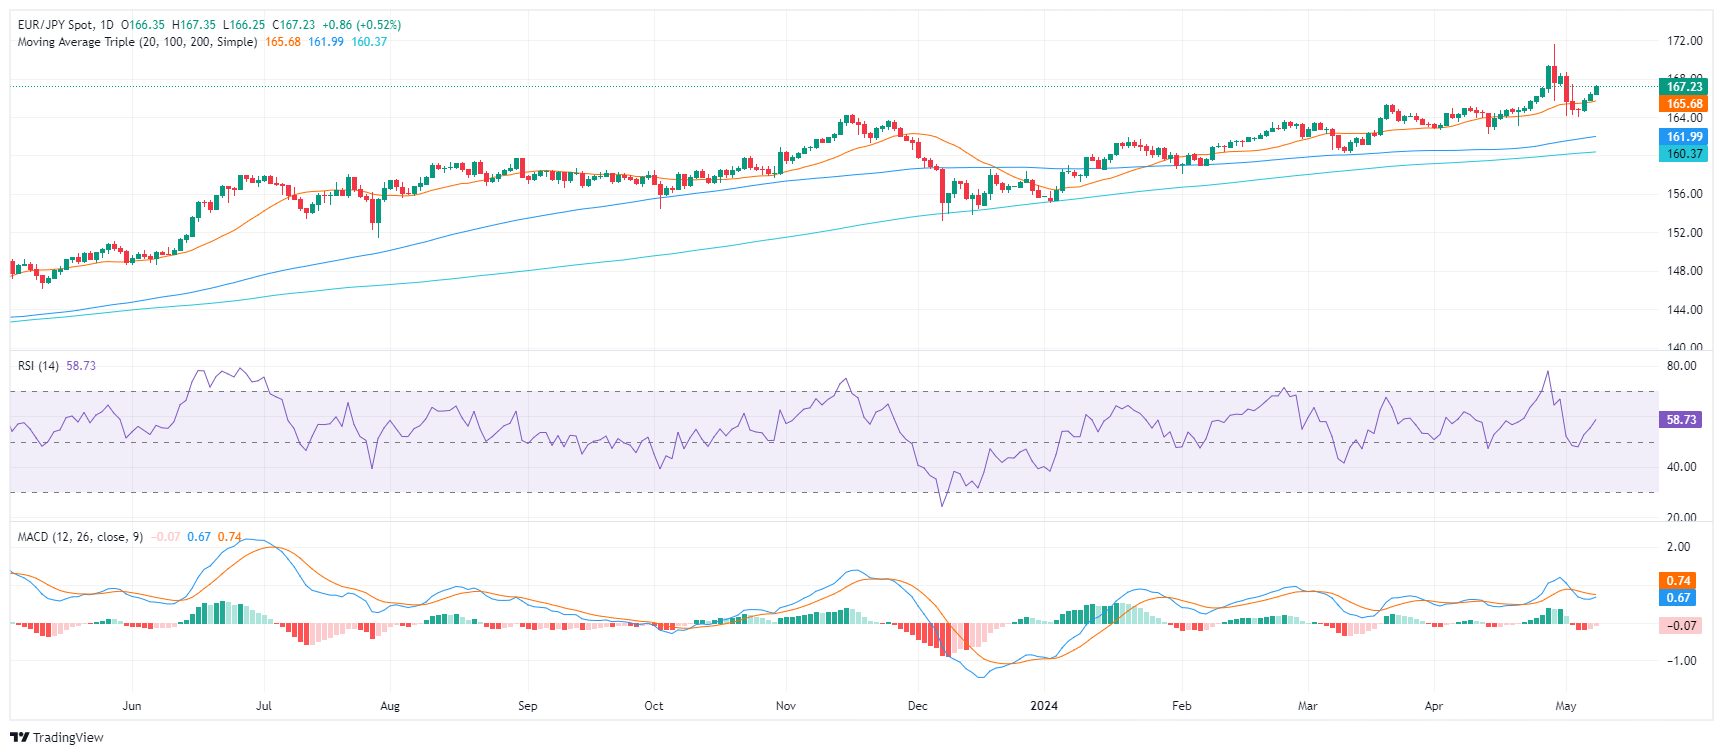
On the daily chart, the Relative Strength Index (RSI) reveals a positive trend. The most recent value of 58 suggests that buyers have been dominating the market while the Moving Average Convergence Divergence (MACD) histogram shows green bars, indicating a consistent rise in positive momentum.
EUR/JPY daily chart
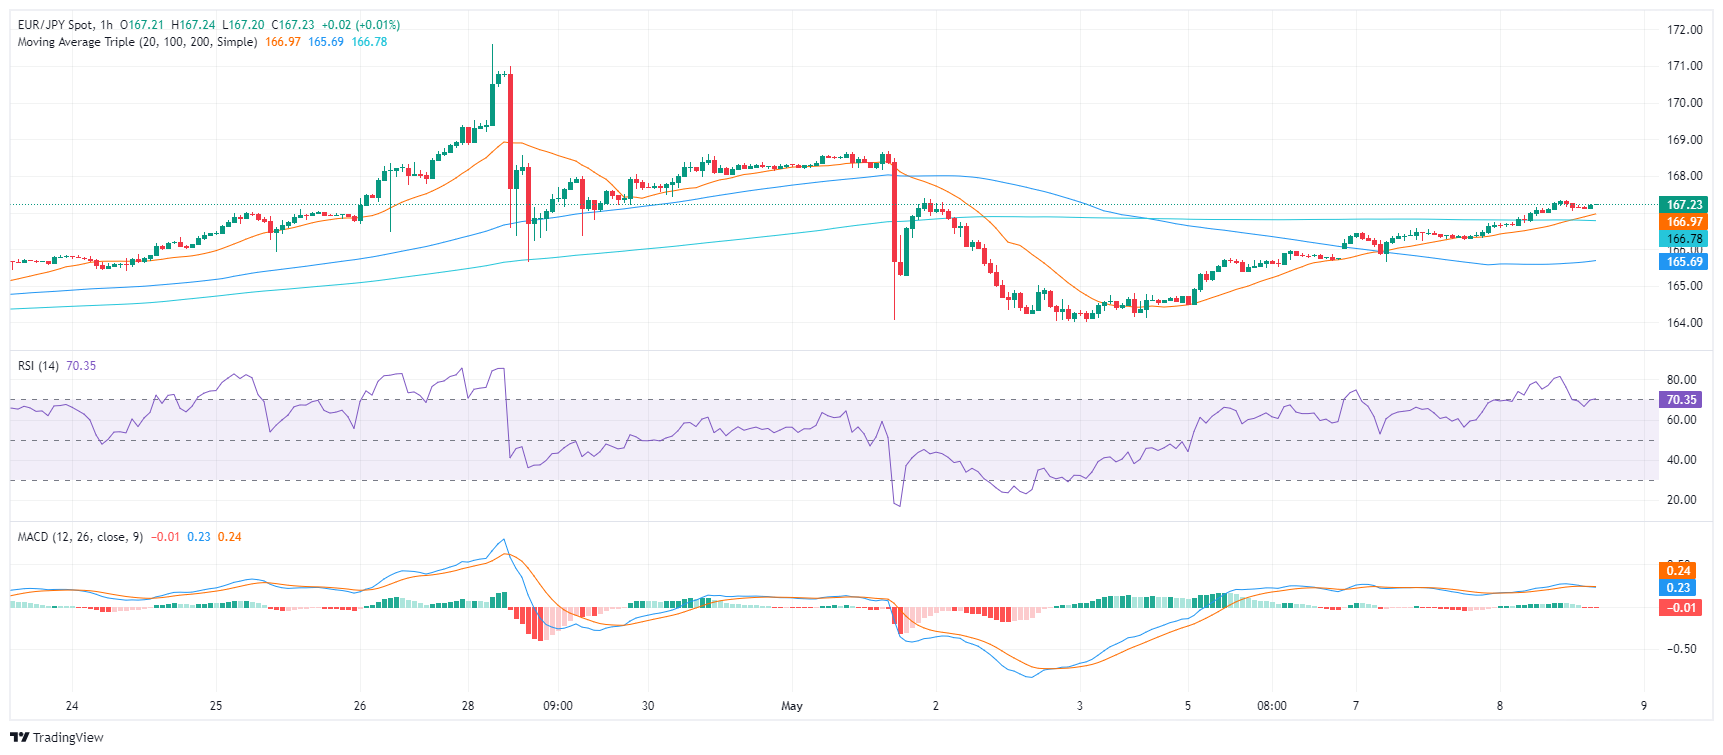
Shifting the focus to the hourly RSI, a more volatile picture is displayed. Values have fluctuated, generally remaining positive, with the latest reading at 69 near the overbought terrain. Whereas, the hourly MACD has registered flat red bars, indicating a lack of positive momentum in recent hours as investors seems to be taking profits.
EUR/JPY hourly chart
Reflecting on the broad spectrum, the EUR/JPY is currently positioned above its Simple Moving Average (SMA) across the 20, 100, and 200-days. This indicates a strong upward momentum in both the short-term and long-term periods.
In conclusion, the daily and hourly technical indicators and a notable position above the SMA suggest an overall bullish outlook for the pair. However, the contrast in the hourly MACD with the daily trends urges traders to exercise caution as buyers may take their foot off the gas ahead of the Asian session which would pave the way for some downside.
Forex News
Keep up with the financial markets, know what's happening and what is affecting the markets with our latest market updates. Analyze market movers, trends and build your trading strategies accordingly.


