
USD/NOK gains ground as markets digest Fed official's words, Eurozone outlook
- Latest statements reveal a more assertive posture from Fed officials, potentially cooling expectations of rate cuts.
- Soft economic figures from the German and Eurozone economies may stimulate bearish perspectives for the NOK.
The USD/NOK pair is currently trading with 0.60% gains on Tuesday, despite broad market predictions of a softened US monetary policy. This resurgence is fueled by an aggressive approach from Federal Reserve (Fed) officials at the beginning of the week. On the other hand, the Norwegian Krone (NOK) faces uncertainty as critical European economic indicators underperform and the possibility of a rate cut from the European Central Bank (ECB) grows.
Monetary policy stances, notably a more assertive position from Fed officials, appear to be the key drive behind recent USD strength. The notion of an impending easing in the Fed’s monetary policy was contested, with many Fed officials mirroring Powell’s tone, thus promoting a more hawkish bias that limits the downside for the USD.
On the other hand, in the Eurozone, expectations are skewed towards a rate cut scheduled for June from the ECB. In addition, Recent data showed weak March factory orders from Germany and as countries across the eurozone soften, it increases the probability of a bearish scenario for the Norwegian Krone.
USD/NOK technical analysis
Based on the indicators of the daily chart, the Relative Strength Index (RSI) reveals a negative trend for the USD/NOK. The most recent RSI figure is in negative territory, although showing a marginal recovery from the previous session. This suggests that sellers are currently dominating the market but that bulls present a battle. In addition, the Moving Average Convergence Divergence (MACD) is producing flat red bars, indicating negative momentum and reinforcing that sellers dominate at present. However, a limited upward shift on the daily RSI could hint at potential volatility or a slight pullback.
USD/NOK daily chart
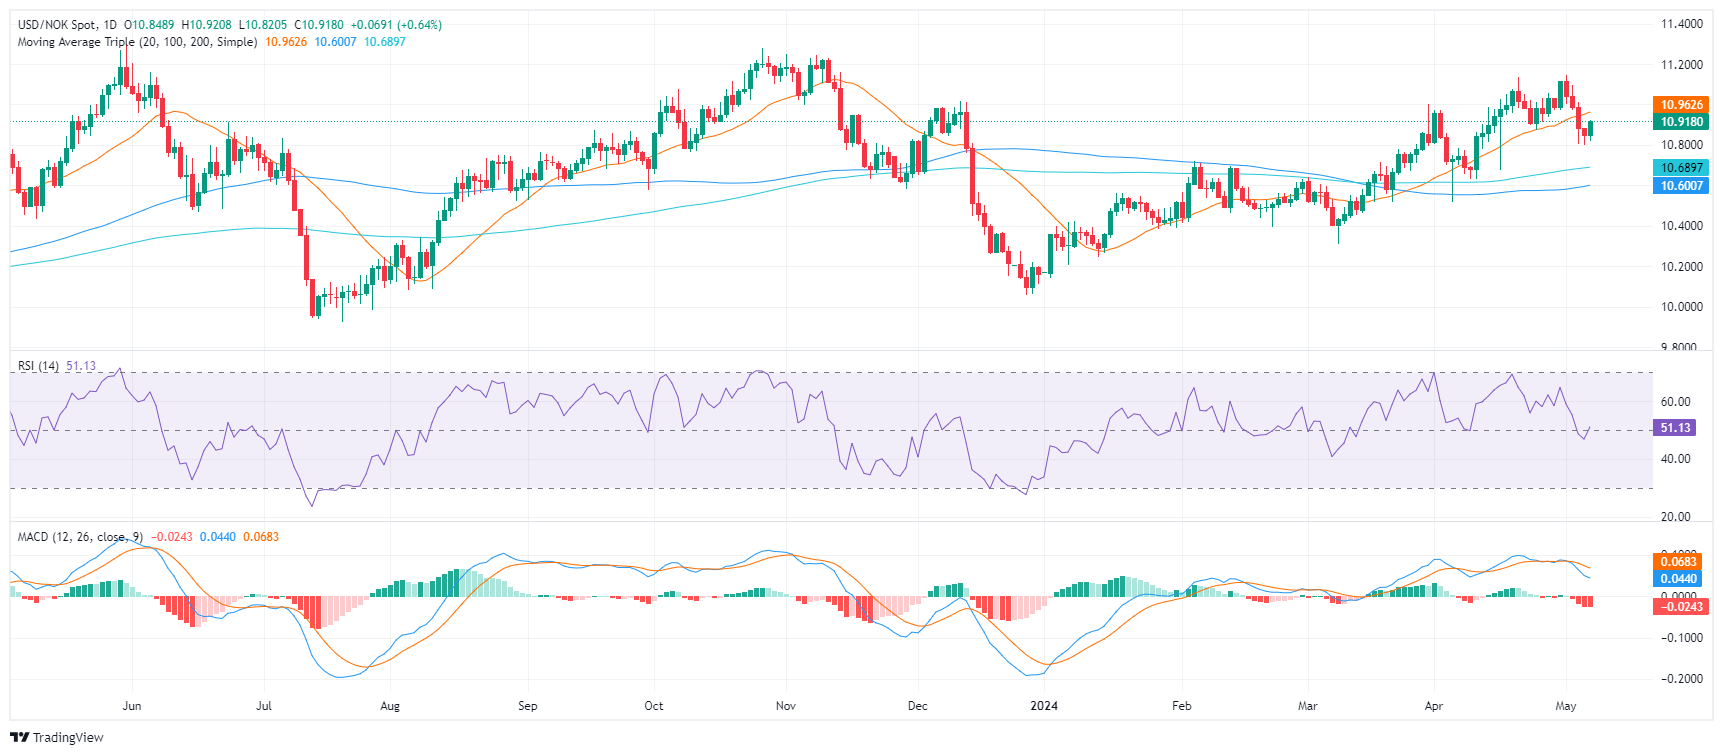
In the wider perspective, the USD/NOK pair is revealing signs of bullish momentum as it is positioned above the Simple Moving Averages (SMA) for the 100, and 200-day periods. This positioning indicates a continuation of the bullish dominance that traders should take into account. However, the short term is in the hands of the bears as they drove the pair below the 20-day SMA.
Forex News
Keep up with the financial markets, know what's happening and what is affecting the markets with our latest market updates. Analyze market movers, trends and build your trading strategies accordingly.