GBP/USD Price Analysis: Range bound around 200-DMA, awaiting BoE’s decision
- GBP/USD trades with minor losses, movements bounded by key levels before BoE decision.
- Technical outlook neutral to slightly bullish; resistance at recent high of 1.2594 and 50-DMA at 1.2607.
- Break below 200-DMA at 1.2545 could trigger further declines, with supports at 1.2500 and May 1 low of 1.2466.
The Pound Sterling registers anemic losses against the US Dollar as traders brace for the Bank of England’s (BoE) monetary policy decision on Thursday. The pair remained within the 1.2529-1.2594 boundaries during the last few days, capped by key support and resistance levels. The GBP/USD trades at 1.2556, down 0.04%.
GBP/USD Price Analysis: Technical outlook
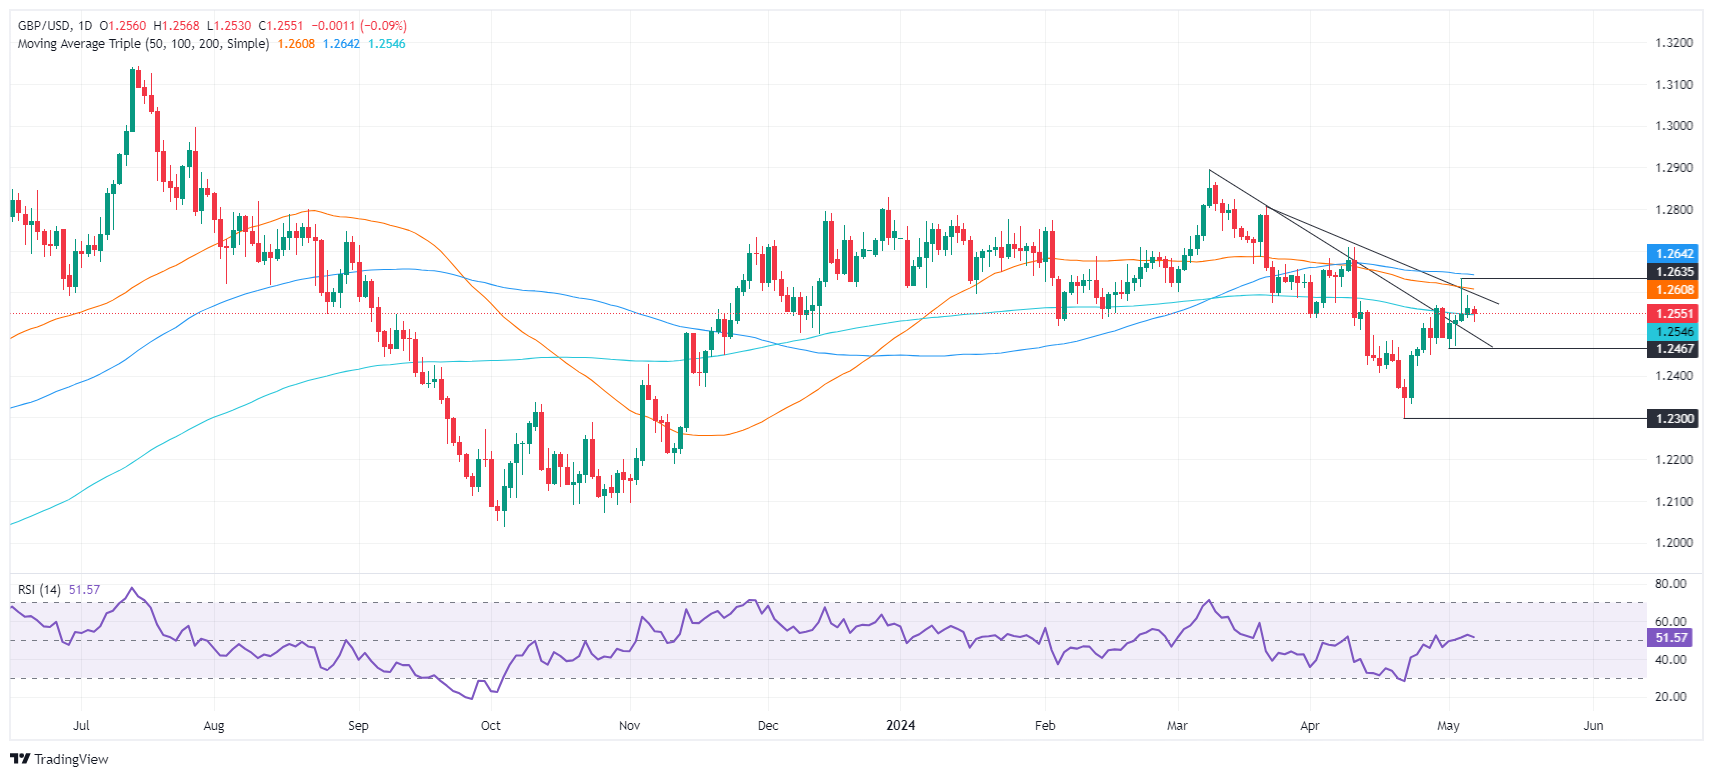
The daily chart portrays the pair as neutral-biased, with momentum skewed to the upside, as depicted by the Relative Strength Index (RSI). The RSI is bullish, though close to the 50-midline, an indication that volatile price action could trigger a momentum shift.
With that said the first resistance of the GBP/USD would be the May 6 high at 1.2594. Once cleared, that could pave the way to test 1.2600, ahead of the 50-day moving average (DMA) at 1.2607. Further upside is seen at the 100-DMA at 1.2640, followed by the April 9 high at 1.2709.
On the other hand, if the GBP/USD dips below the 200-DMA at 1.2545, that would exacerbate a test of 1.2500. Once hurdled, the next support emerged at the May 1 low of 1.2466, followed by the 1.2400 figure.
GBP/USD Price Action – Daily Chart
Forex News
Keep up with the financial markets, know what's happening and what is affecting the markets with our latest market updates. Analyze market movers, trends and build your trading strategies accordingly.