
US Dollar Index Price Analysis: Overbought RSI probes DXY bulls at yearly high
- DXY pauses around yearly top following the heaviest daily jump since mid-June.
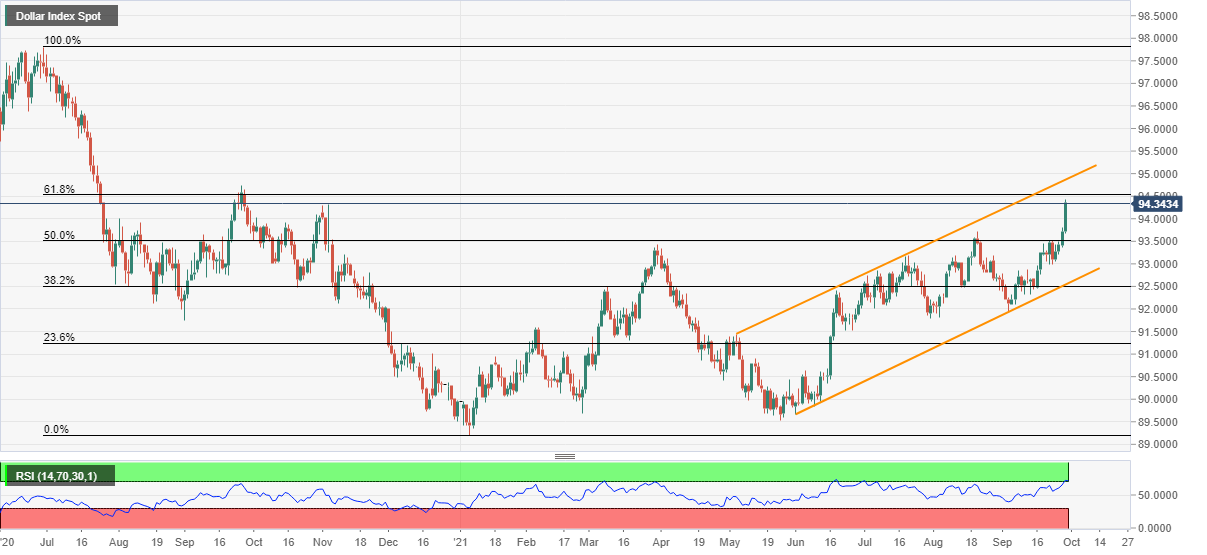
- Overbought RSI hints at a pullback move but November 2020 top tests the moves.
- 61.8% Fibonacci retracement, September 2020 peak add to the upside filters inside five-month-old rising channel.
US Dollar Index (DXY) bulls take a breather around the yearly high of 94.40 during the sluggish Asian session on Thursday.
The greenback gauge jumped the most in 15 weeks the previous day but the overbought RSI conditions seem to challenge the bulls of late.
However, the pullback moves need validation from the November 2020 peak surrounding 94.30, a break of which will recall the 94.00 threshold on the chart.
Following that, the August month high near 93.72 and March’s top close to 93.45 will lure the DXY bears.
On the flip side, the bull’s ignorance of the RSI conditions will direct them to confront the 61.8% Fibonacci retracement of June 2020 to January 2021 downside, near 94.55.
Also likely to challenge the US Dollar Index upside is the September 2020 high of 94.74 and the upper line of an ascending trend channel from May, near 94.85.
Overall, DXY remains bullish but a pullback can’t be ruled out.
DXY: Daily chart
Trend: Pullback expected
Forex News
Keep up with the financial markets, know what's happening and what is affecting the markets with our latest market updates. Analyze market movers, trends and build your trading strategies accordingly.