Silver Price Analysis: Continues lower after Bearish Engulfing
- Silver price continues falling after touching the top of its range and forming a Bearish Engulfing candlestick pattern.
- The MACD has crossed its signal line giving a sell signal.
- Silver price will probably fall towards a cluster of MAs in the $23.000s
Silver price (XAG/USD) is trading in the $24.580s on Friday. It has just reversed after touching the top of a multi-month range.
Silver rallied up during the first half of March until it reached the ceiling of a long-term range at around $25.750. At that point it reversed and formed a Bearish Engulfing Japanese candlestick pattern on the following day, Mar 21 (circled).
A Bearish Engulfing is an indicator of a short-term reversal in price. It forms when a red candlestick’s whole daily range completely encloses, or “engulfs”, the previous day’s range. The appearance of the pattern adds a further bearish hue to the picture.
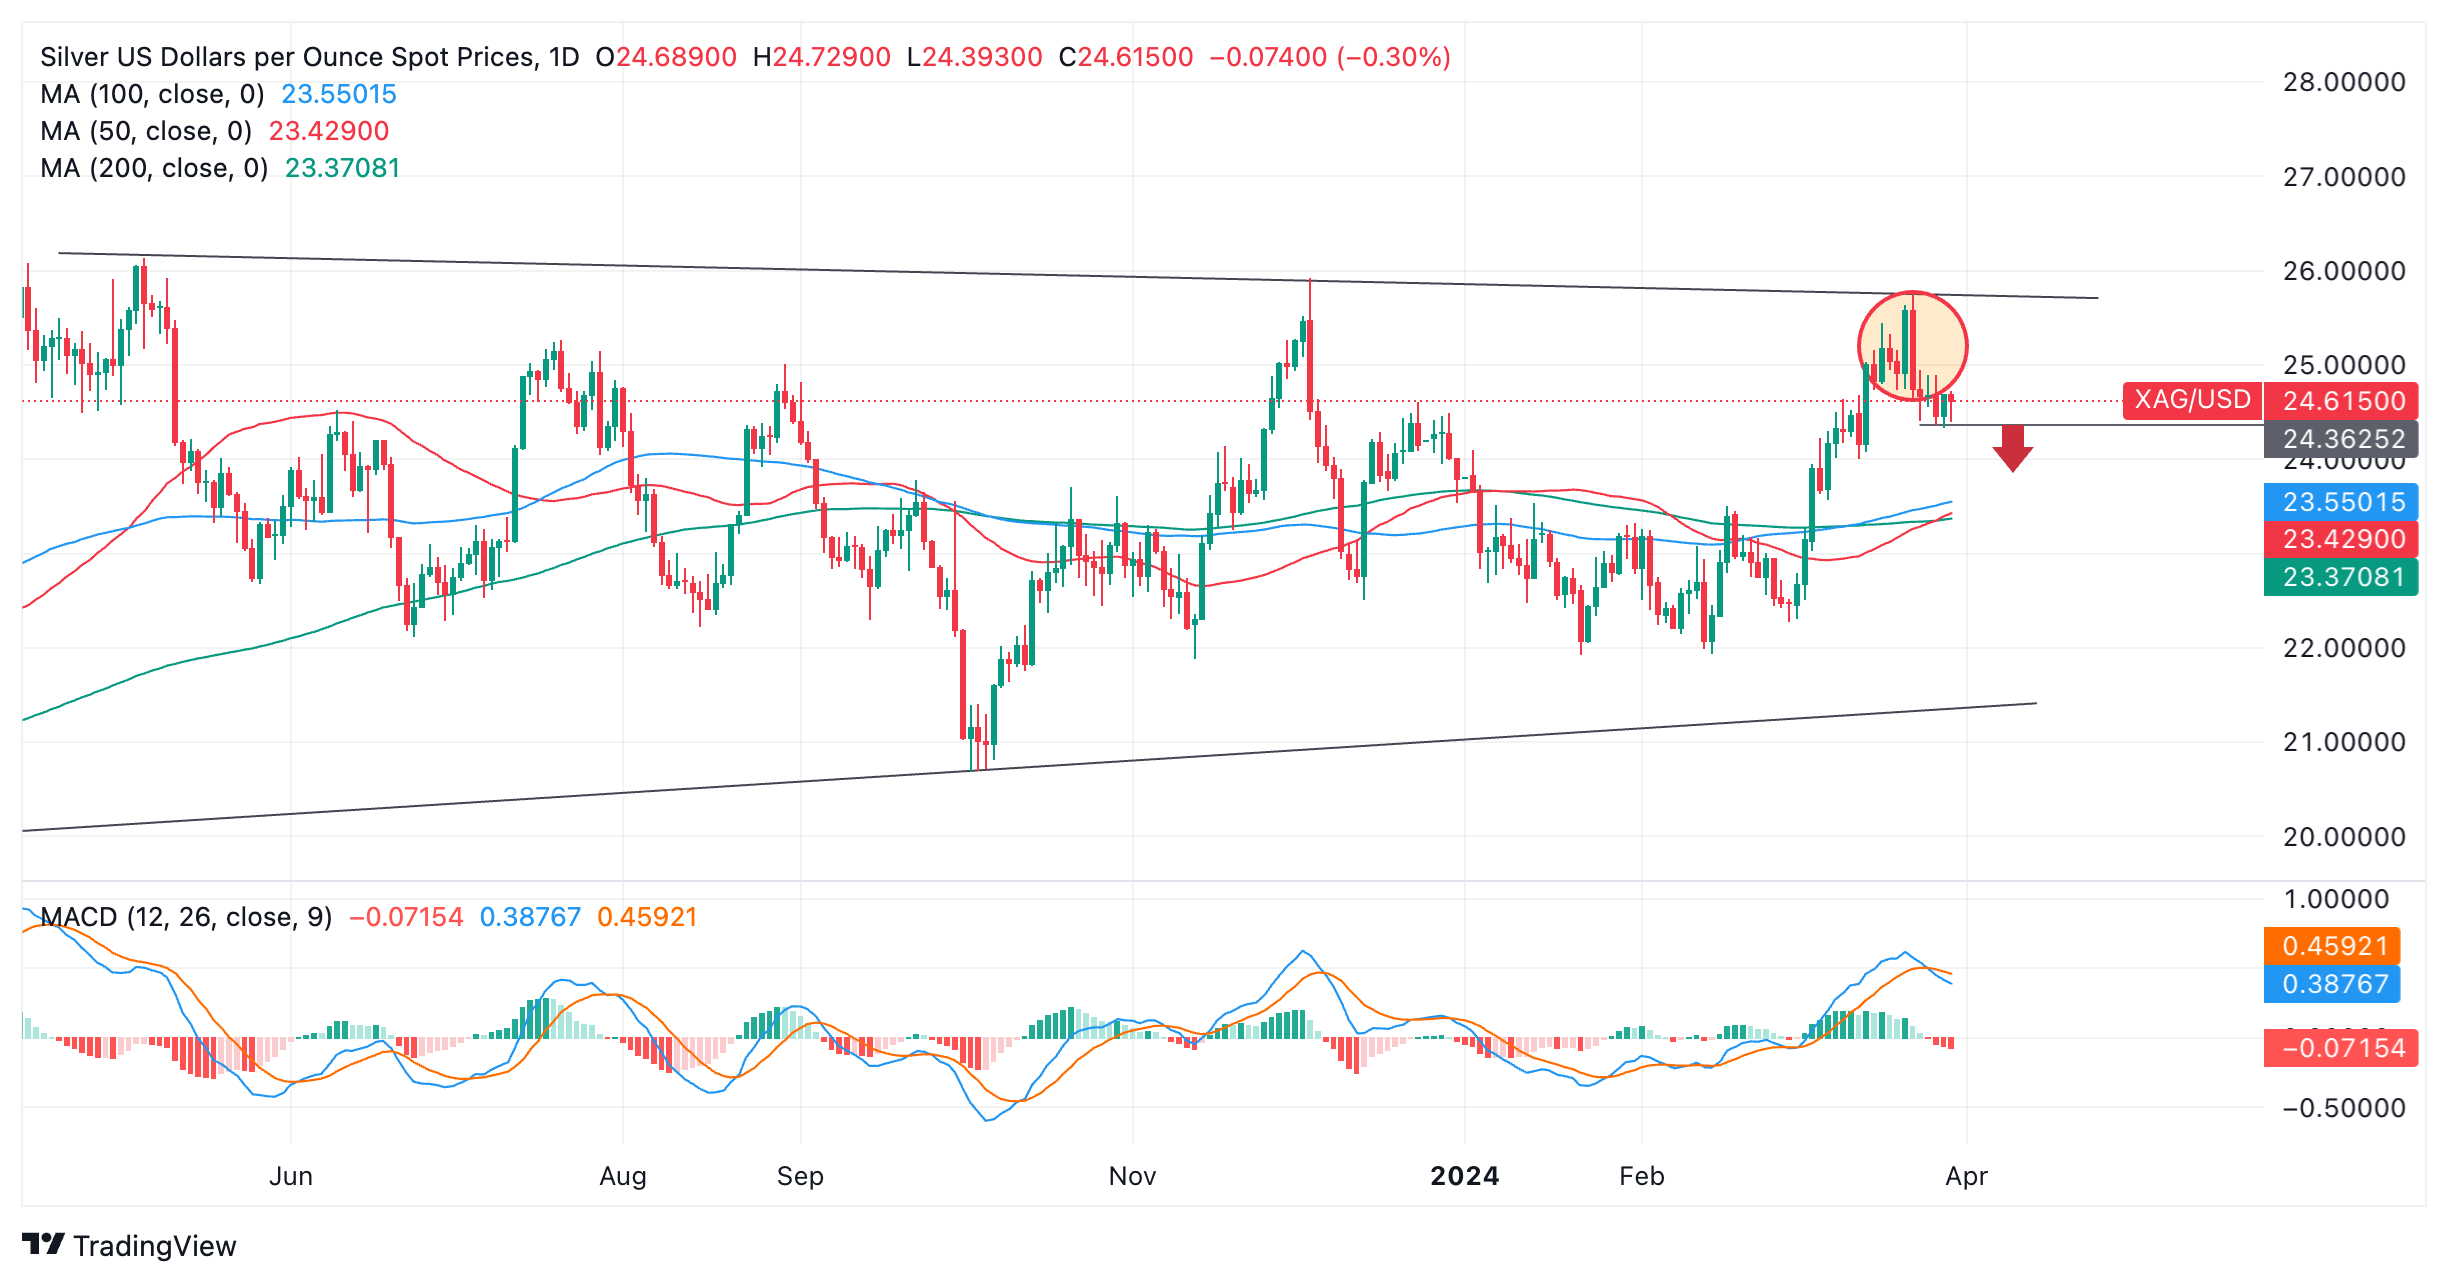
Silver versus US Dollar: Daily chart
The Moving Average Convergence/ Divergence (MACD) momentum indicator has crossed below its signal line, giving a sell signal. The MACD is an especially reliable indicator within range-bound markets and adds credence to the bearish view.
The pair will probably continue south to a potential target at the cluster of major moving averages, in the lower $23.000s. The topmost is the 100-day Simple Moving Average (SMA) at $23.550.
A break below the $24.320 levels of March 27 would provide more bearish confidence of a move lower.
Alternatively if bulls take back control, a break back above the $25.770 highs of Thursday would probably indicate an extension of the uptrend.
A decisive break above the range highs would indicate more upside. Such a move would be expected to then reach a conservative target at the 0.618 Fibonacci extrapolation of the height of the range from the breakout point higher, and a target at $28.524.
A decisive break is one in which a level is breached by a long green candlestick which closes near its high, or three green candlesticks that break above the level.
Forex News
Keep up with the financial markets, know what's happening and what is affecting the markets with our latest market updates. Analyze market movers, trends and build your trading strategies accordingly.