
EUR/JPY Price Analysis: Rallies to almost 16-year high, buyers eye 167.00
- EUR/JPY surges to levels not seen since August 2008, capitalizing on a broader Yen weakness.
- Technical indicators suggest potential for further advances after clearing resistance at 165.30, towards the 169.47 high of August 2008.
- Downside risks remain once EUR/JPY retreats below the recent high of 166.22.
The Euro rallied to a near 16-year high against the Japanese Yen, hitting levels last seen in August 2008, with the latter remaining the laggard in the FX space. Data from the United States (US) prompted investors to buy the Greenback, which sent USD/JPY to refresh multi-year highs. Therefore, the EUR/JPY followed suit and trades at 166.67, gaining more than 0.20%.
EUR/JPY Price Analysis: Technical outlook
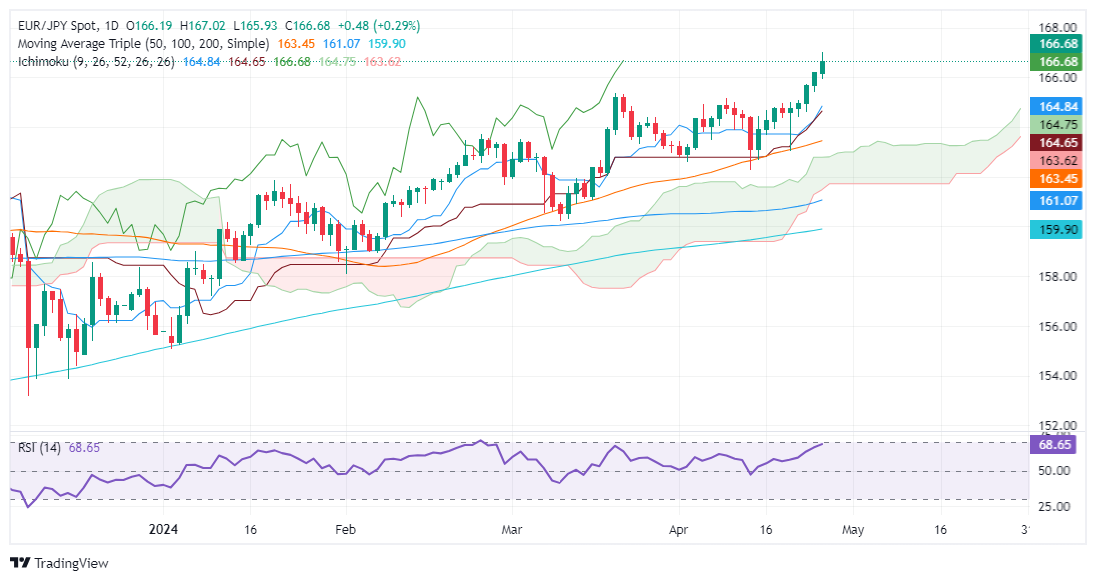
The EUR/JPY is bullish-biased after consolidating since mid-March below the 165.30s area, previously guarded by March’s 20 high at 165.33. The uptrend resumed toward the 166.00 mark, yet once buyers cleared that hurdle, extending the move to 167.00.
Nevertheless, the EUR/JPY has retreated as buyers take a breather. The momentum its on their side, as shown by the Relative Strength Index (RSI) standing at 68.80, shy of signaling the pair is overbought.
If buyers clear 167.00, that will exacerbate a rally to challenge August’s 2008 monthly high at 169.47, ahead of the psychological 170.00 barrier.
On the other hand, if sellers drag the exchange rate below 166.22 April 24 daily high, that could open the door to sliding toward the March 20 high of 165.33. Subsequent losses beyond this support target the confluence of the Tenkan and Kijun-Sen at 164.83/64.
EUR/JPY Price Action – Daily Chart
Forex News
Keep up with the financial markets, know what's happening and what is affecting the markets with our latest market updates. Analyze market movers, trends and build your trading strategies accordingly.


