USD/CAD depreciates to near 1.3650 due to higher crude prices, US PCE eyed
- USD/CAD loses ground due to higher crude Oil prices on Friday.
- WTI Oil price appreciates due to geopolitical risks associated with a potential Israeli invasion of the Rafah city.
- The lower US labor data has offset concerns regarding the sluggish GDP (Q1).
USD/CAD extends its losses for the second consecutive day, trading around 1.3640 during the Asian session on Friday. The Canadian Dollar (CAD) receives support from higher US crude Oil prices, contributing to the weakening of the USD/CAD pair.
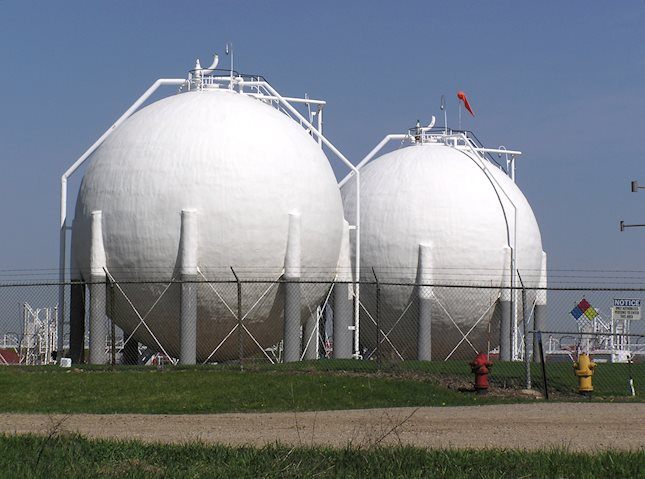
West Texas Intermediate (WTI) crude Oil price edges higher to near $83.80 per barrel, supported by potential geopolitical risks stemming from a possible Israeli invasion of the southern Gaza city of Rafah.
On the data front, recent Canadian Retail Sales data for February highlighted economic deceleration. Additionally, domestic annual inflation in Canada stood at 2.9% in March, below expectations, indicating the potential for lower underlying inflation. This scenario may lead the Bank of Canada to consider interest rate cuts, which could limit the gains of the Canadian Dollar.
In contrast, US labor data offset sluggish GDP growth, dampening expectations for Federal Reserve interest rate cuts. The US Gross Domestic Product Annualized (Q1) expanded at a slower pace of 1.6% compared to the previous reading of 3.4%, falling short of market expectations of 2.5%. The slowdown in the US economy suggests potential challenges or deceleration in various sectors. Looking ahead, market attention is now focused on the US Personal Consumption Expenditures (PCE) Price Index data for March, scheduled for release on Friday.
Additionally, the US Initial Jobless Claims for the week ending on April 19 saw a significant decrease, dropping by 5,000 to 207,000. This figure marks the lowest level seen in two months and exceeds both market expectations of 214,000 and the previous reading of 212,000. The unexpected decline in jobless claims indicates a strengthening labor market, implying reduced layoffs and potentially increased hiring activity.
Forex News
Keep up with the financial markets, know what's happening and what is affecting the markets with our latest market updates. Analyze market movers, trends and build your trading strategies accordingly.