EUR/USD stays firm, shy of 1.0700 amid strong US Dollar and elevated US yields
- EUR/USD maintains a position slightly above 1.0700, with minimal change despite a strong recovery in the US Dollar.
- US Treasury yields increase after significant durable goods data and a major five-year note sale, impacting market sentiment.
- Upcoming US GDP and Core PCE data, along with German consumer confidence figures, are next on the economic calendar.
The Euro is steady against the US Dollar, virtually unchanged after solid data from the United States (US) boosted the Greenback, which recovered from Tuesday's losses. However, the EUR/USD stands below the 1.0700 threshold posting minimal gains of 0.01%.
EUR/USD is flatlined ahead of crucial US GDP and inflation data
The market mood shifted sour as the US Treasury yields edged up after a record $70 billion sale of five-year notes in the US fixed-income market. In the meantime, the US Department of Commerce showed that US Durable Goods Orders increased in March, expanding by 2.6% MoM, up from a 0.7% rise previously and surpassing 2.5% estimates. Core goods, which excluded transportation, increased by 0.2% MoM, an improvement over February's 0.1% increase, but fell short of the 0.3% projected.
Today’s data contrasts with Tuesday’s S&P Global PMI figures in the US. Although business activity has eased somewhat, Goods Orders figures crushed February’s figures, signaling the economy remains strong.
On Thursday, the US Bureau of Economic Analysis (BEA) will reveal the Gross Domestic Product (GDP) for the first quarter of 2024, estimated at 2.5%, down from 3.4% in Q4 2023. At the same time, Initial Jobless Claims are expected to increase from 212K to 214K.
Besides that, EUR/USD traders would be eyeing the release of the Core Personal Consumption Expenditures (PCE) Price Index, the Federal Reserve’s preferred inflation gauge, which is estimated to remain steady at 0.3%. The annual Core PCE rate is expected to ease to 2.6%, down from February's rate of 2.8%, indicating a potential softening of inflation pressure.
Across the pond, traders would be eyeing the release of Germany’s GfK Consumer Confidence for May, projected to improve from -27.4 to -25.9.
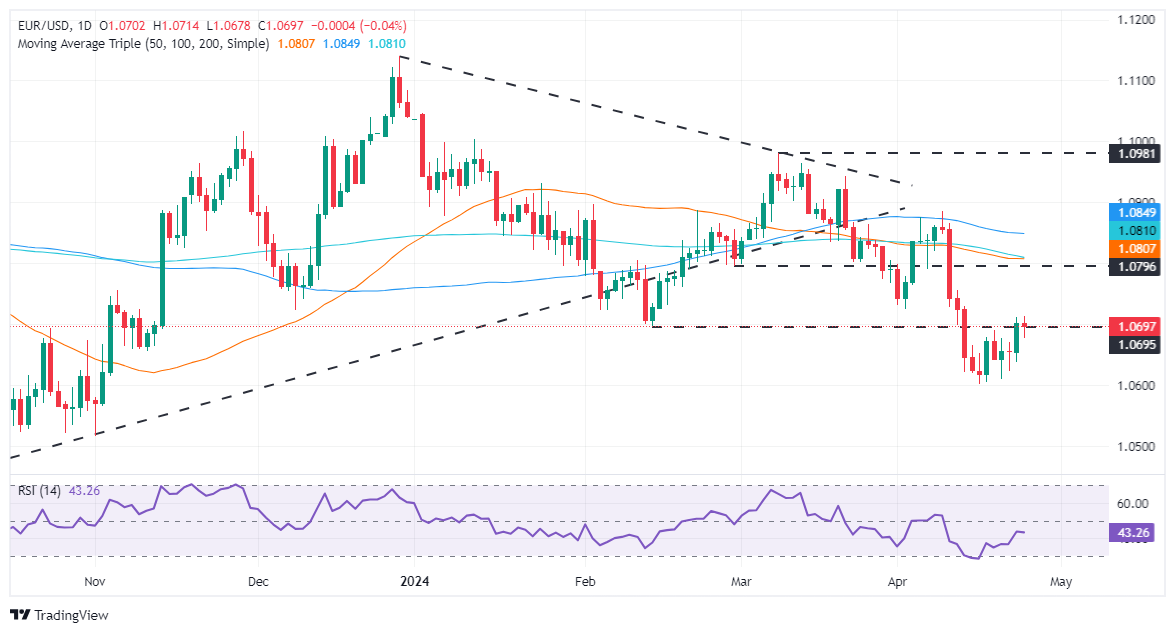
EUR/USD Price Analysis: Technical outlook
Even though the EUR/USD seems to have bottomed at around 1.0600, buyers' failure to achieve a daily close above 1.0700 could pave the way for a re-test of the year-to-date (YTD) low at 1.0601. In that event, a breach of the latter, will expose a key support level at 1.0448, the October 3, 2023, swing low. On the upside, if buyers keep the spot price above 1.0700, look for a test of the psychological 1.0750 before aiming toward the confluence of the 50 and 200-DMA.
Forex News
Keep up with the financial markets, know what's happening and what is affecting the markets with our latest market updates. Analyze market movers, trends and build your trading strategies accordingly.


