
Japanese Yen sticks to intraday losses amid positive risk tone; USD/JPY holds steady around mid-142.00s
- The Japanese Yen attracts some sellers as easing trade tensions undermines safe-haven demand.
- Hopes for a US-Japan trade deal and geopolitical risks should help limit any meaningful downfall.
- The divergent BoJ-Fed policy expectations should further lend support to the lower-yielding JPY.
The Japanese Yen (JPY) retains its negative bias heading into the European session on Tuesday as hopes for the de-escalation of the US-China trade war continue to undermine demand for traditional safe-haven assets. Apart from this, the emergence of some US Dollar (USD) buying assists the USD/JPY pair to stick to modest intraday gains around mid-142.00s. The JPY bears, however, might refrain from placing aggressive bets and opt to wait for the crucial Bank of Japan (BoJ) meeting this week.
The Japanese central bank is scheduled to announce its policy decision on Thursday and is expected to keep interest rates steady amid risks to the fragile economy from US tariffs. However, signs of broadening inflation in Japan keep the door open for further tightening by the BoJ. Moreover, persistent geopolitical tensions and the uncertainty over US President Donald Trump's trade policies keep investors on the edge. Furthermore, bets for more aggressive policy easing by the Federal Reserve (Fed) should cap any meaningful USD gains and contribute to limiting deeper losses for the lower-yielding JPY.
Japanese Yen remains depressed against mildly stronger USD amid receding safe-haven demand
- US Treasury Secretary Scott Bessent said on Monday that many countries have offered ’very good’ tariff proposals. This comes on top of optimism over the potential de-escalation of trade tensions between the US and China and remains supportive of a positive risk tone.
- However, mixed signals regarding the state of negotiations from the US and China add a layer of uncertainty. In fact, US President Donald Trump said last week that trade talks with China were underway, though China has denied that any tariff negotiations were taking place.
- The Bank of Japan is expected to move cautiously and pause further rate hikes amid concerns that the new US tariffs could shave off 0.5% of Japan's GDP. That said, higher inflation and bumper pay rise provide the BoJ headroom for further monetary policy normalization this year.
- Furthermore, a quick trade agreement between the US and Japan could give the BoJ more confidence to hike rates again. This marks a big divergence in comparison to the growing acceptance that slowing global growth will encourage the Federal Reserve to deliver deeper rate cuts.
- Traders are pricing in the possibility that the US central bank will resume its rate-cutting cycle in June and lower borrowing costs by a full percentage point by the end of 2025. The resultant narrowing of the US-Japan rate differential should underpin the lower-yielding Japanese Yen.
- Russian President Vladimir Putin declared a surprise 72-hour unilateral ceasefire in the Ukraine conflict from May 8, though Ukraine’s President Volodymyr Zelensky dismissed the three-day truce. This keeps the geopolitical risk premium in play and could further benefit the safe-haven JPY.
- The US Dollar struggles to capitalize on last week's recovery from a multi-year low, as skepticism over Trump's trade policies and caution ahead of the BoJ meeting and US data cap USD/JPY upside.
- Investors will scrutinize the BoJ’s updated economic projections for cues about the timeline for the next rate hike. Meanwhile, the US JOLTS job openings on Tuesday, US Personal Consumption Expenditures on Wednesday, and the Nonfarm Payrolls (NFP) on Friday might provide insight into the Fed's policy outlook.
USD/JPY needs to surpass 142.60-142.65 barrier to support prospects for further intraday gains
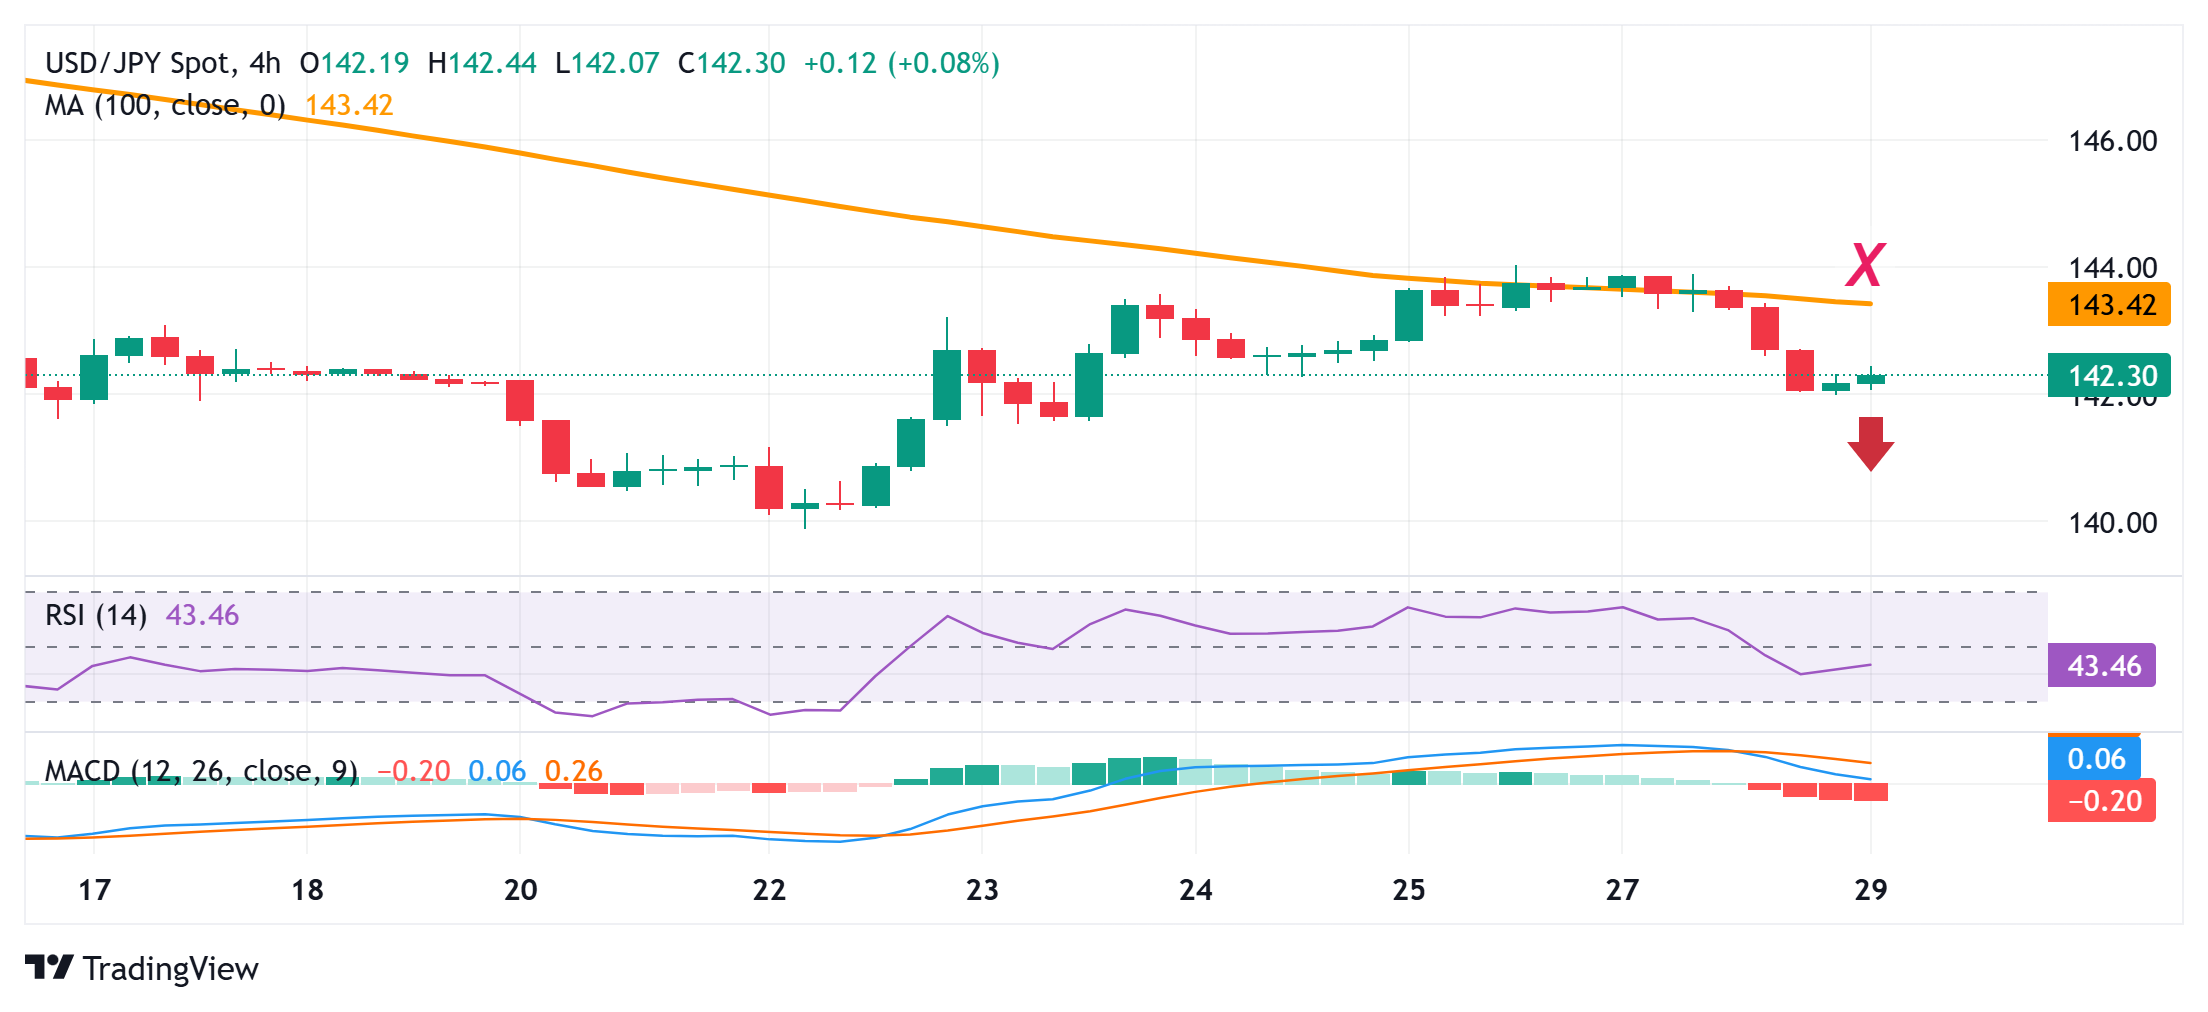
From a technical perspective, the USD/JPY pair struggled to find acceptance above the 100-period Simple Moving Average (SMA) on the 4-hour chart and faced rejection near the 144.00 mark. Given that oscillators are holding in negative territory on daily and hourly charts, some follow-through selling below the 142.00 round figure will be seen as a fresh trigger for bearish traders. Spot prices might then accelerate the fall towards the mid-141.00s en route to the 141.10-141.00 region. The downward trajectory could extend further towards intermediate support near the 140.50 area and eventually expose the multi-month low – levels below the 140.00 psychological mark touched last week.
On the flip side, the immediate hurdle is pegged near the 142.60-142.65 region, above which a bout of a short-covering could lift the USD/JPY pair to the 143.00 mark en route to the next relevant resistance near the 143.40-143.45 zone. Some follow-through buying should allow spot prices to conquer the 144.00 round figure. A sustained strength and acceptance above the latter would suggest that the pair has formed a near-term bottom and pave the way for some meaningful upside.
US Dollar PRICE Today
The table below shows the percentage change of US Dollar (USD) against listed major currencies today. US Dollar was the strongest against the Swiss Franc.
| USD | EUR | GBP | JPY | CAD | AUD | NZD | CHF | |
|---|---|---|---|---|---|---|---|---|
| USD | 0.28% | 0.23% | 0.27% | 0.07% | 0.16% | 0.25% | 0.43% | |
| EUR | -0.28% | -0.01% | 0.02% | -0.18% | -0.09% | -0.02% | 0.17% | |
| GBP | -0.23% | 0.01% | 0.02% | -0.16% | -0.07% | 0.00% | 0.19% | |
| JPY | -0.27% | -0.02% | -0.02% | -0.20% | -0.11% | -0.10% | 0.17% | |
| CAD | -0.07% | 0.18% | 0.16% | 0.20% | 0.08% | 0.17% | 0.35% | |
| AUD | -0.16% | 0.09% | 0.07% | 0.11% | -0.08% | 0.08% | 0.27% | |
| NZD | -0.25% | 0.02% | -0.00% | 0.10% | -0.17% | -0.08% | 0.19% | |
| CHF | -0.43% | -0.17% | -0.19% | -0.17% | -0.35% | -0.27% | -0.19% |
The heat map shows percentage changes of major currencies against each other. The base currency is picked from the left column, while the quote currency is picked from the top row. For example, if you pick the US Dollar from the left column and move along the horizontal line to the Japanese Yen, the percentage change displayed in the box will represent USD (base)/JPY (quote).
Forex News
Keep up with the financial markets, know what's happening and what is affecting the markets with our latest market updates. Analyze market movers, trends and build your trading strategies accordingly.