
Gold Price Forecast: XAU/USD keeps downside opened towards $1717 – Confluence Detector
- Gold price sees a dead cat bounce as USD looks to regain poise.
- Focus remains on Fed’s tightening, underpinning Treasury yields.
- Gold remains vulnerable amid hawkish Fed outlook.
There seems to be no respite for gold price, as the risks remain skewed to the downside amid the immense strength seen in the US dollar and the Treasury yields so far this week. The Fed remains well on track to withdraw the stimulus support later this year, with markets pricing a rate hike in 2022. The hawkish Fed narrative and higher inflation seeming temporary keep the bullish undertone intact in the US yields, weighing negatively on the yields gold. Further, fading worries over the US government shutdown also adds to the greenback’s strength at gold’s expense.
Looking ahead, the dynamics in the yields and quarter-end flows will have a significant bearing on gold price.
Read: Gold Price Forecast: Defending $1720 is critical for XAU/USD bulls, as focus shifts to US data
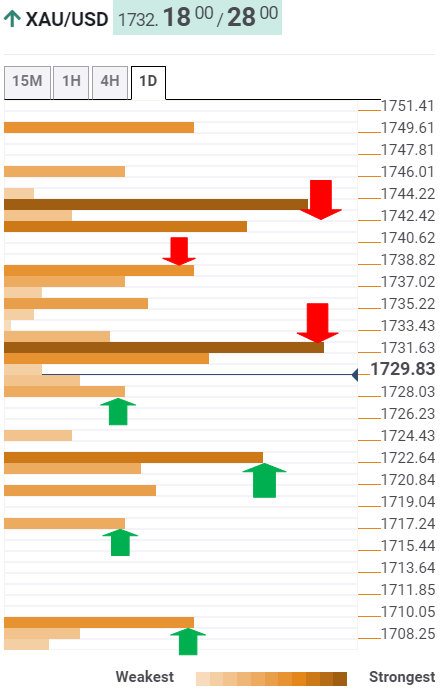
Gold Price: Key levels to watch
According to the Technical Confluences Detector, gold has run into offers at higher levels, now turning south to the Fibonacci 23.6% one-day at $1727.
Sellers will then target the intersection of the previous day’s low and Fibonacci 23.6% one-month at $1722.
Further down, the pivot point one-day S1 at $1717 could come to the buyers’ rescue.
Gold price could see a free-fall towards the pivot point one-week S2 at $1710 should the aforesaid cushion give way.
On the upside, immediate resistance awaits around $1731, which is the confluence of the Fibonacci 38.2% one-day, pivot point one-week S1 and SMA10 one-hour.
Next, the bulls could aim for the previous high four-hour at $1735, above which the convergence of the Fibonacci 61.8% one-day and the previous week’s low at $1738 will come into play.
Powerful hurdle around $1740-$1742 will test the bearish commitment if the recovery gains momentum. That area is confluence of the Fibonacci 38.2% one-month, pivot point one-day R1 and SMA5 one-day.
Here is how it looks on the tool
About Technical Confluences Detector
The TCD (Technical Confluences Detector) is a tool to locate and point out those price levels where there is a congestion of indicators, moving averages, Fibonacci levels, Pivot Points, etc. If you are a short-term trader, you will find entry points for counter-trend strategies and hunt a few points at a time. If you are a medium-to-long-term trader, this tool will allow you to know in advance the price levels where a medium-to-long-term trend may stop and rest, where to unwind positions, or where to increase your position size.
Forex News
Keep up with the financial markets, know what's happening and what is affecting the markets with our latest market updates. Analyze market movers, trends and build your trading strategies accordingly.