Oil Price Analysis: Consolidating within a short-term uptrend
- WTI Oil is in a short-term uptrend within a rising price channel.
- The commodity has pulled back and is consolidating – its next move could be critical.
- A move below the range lows could flip the trend bearish; a rise above the March high bullish.
WTI Oil price (OIL) is trading within an ascending channel whose rising peaks and troughs indicate the commodity is in a short-term uptrend.
Given the old adage that “the trend is your friend till the bend at the end,” the price is favored to continue rising in the short-term until the weight of evidence suggests it has reversed.
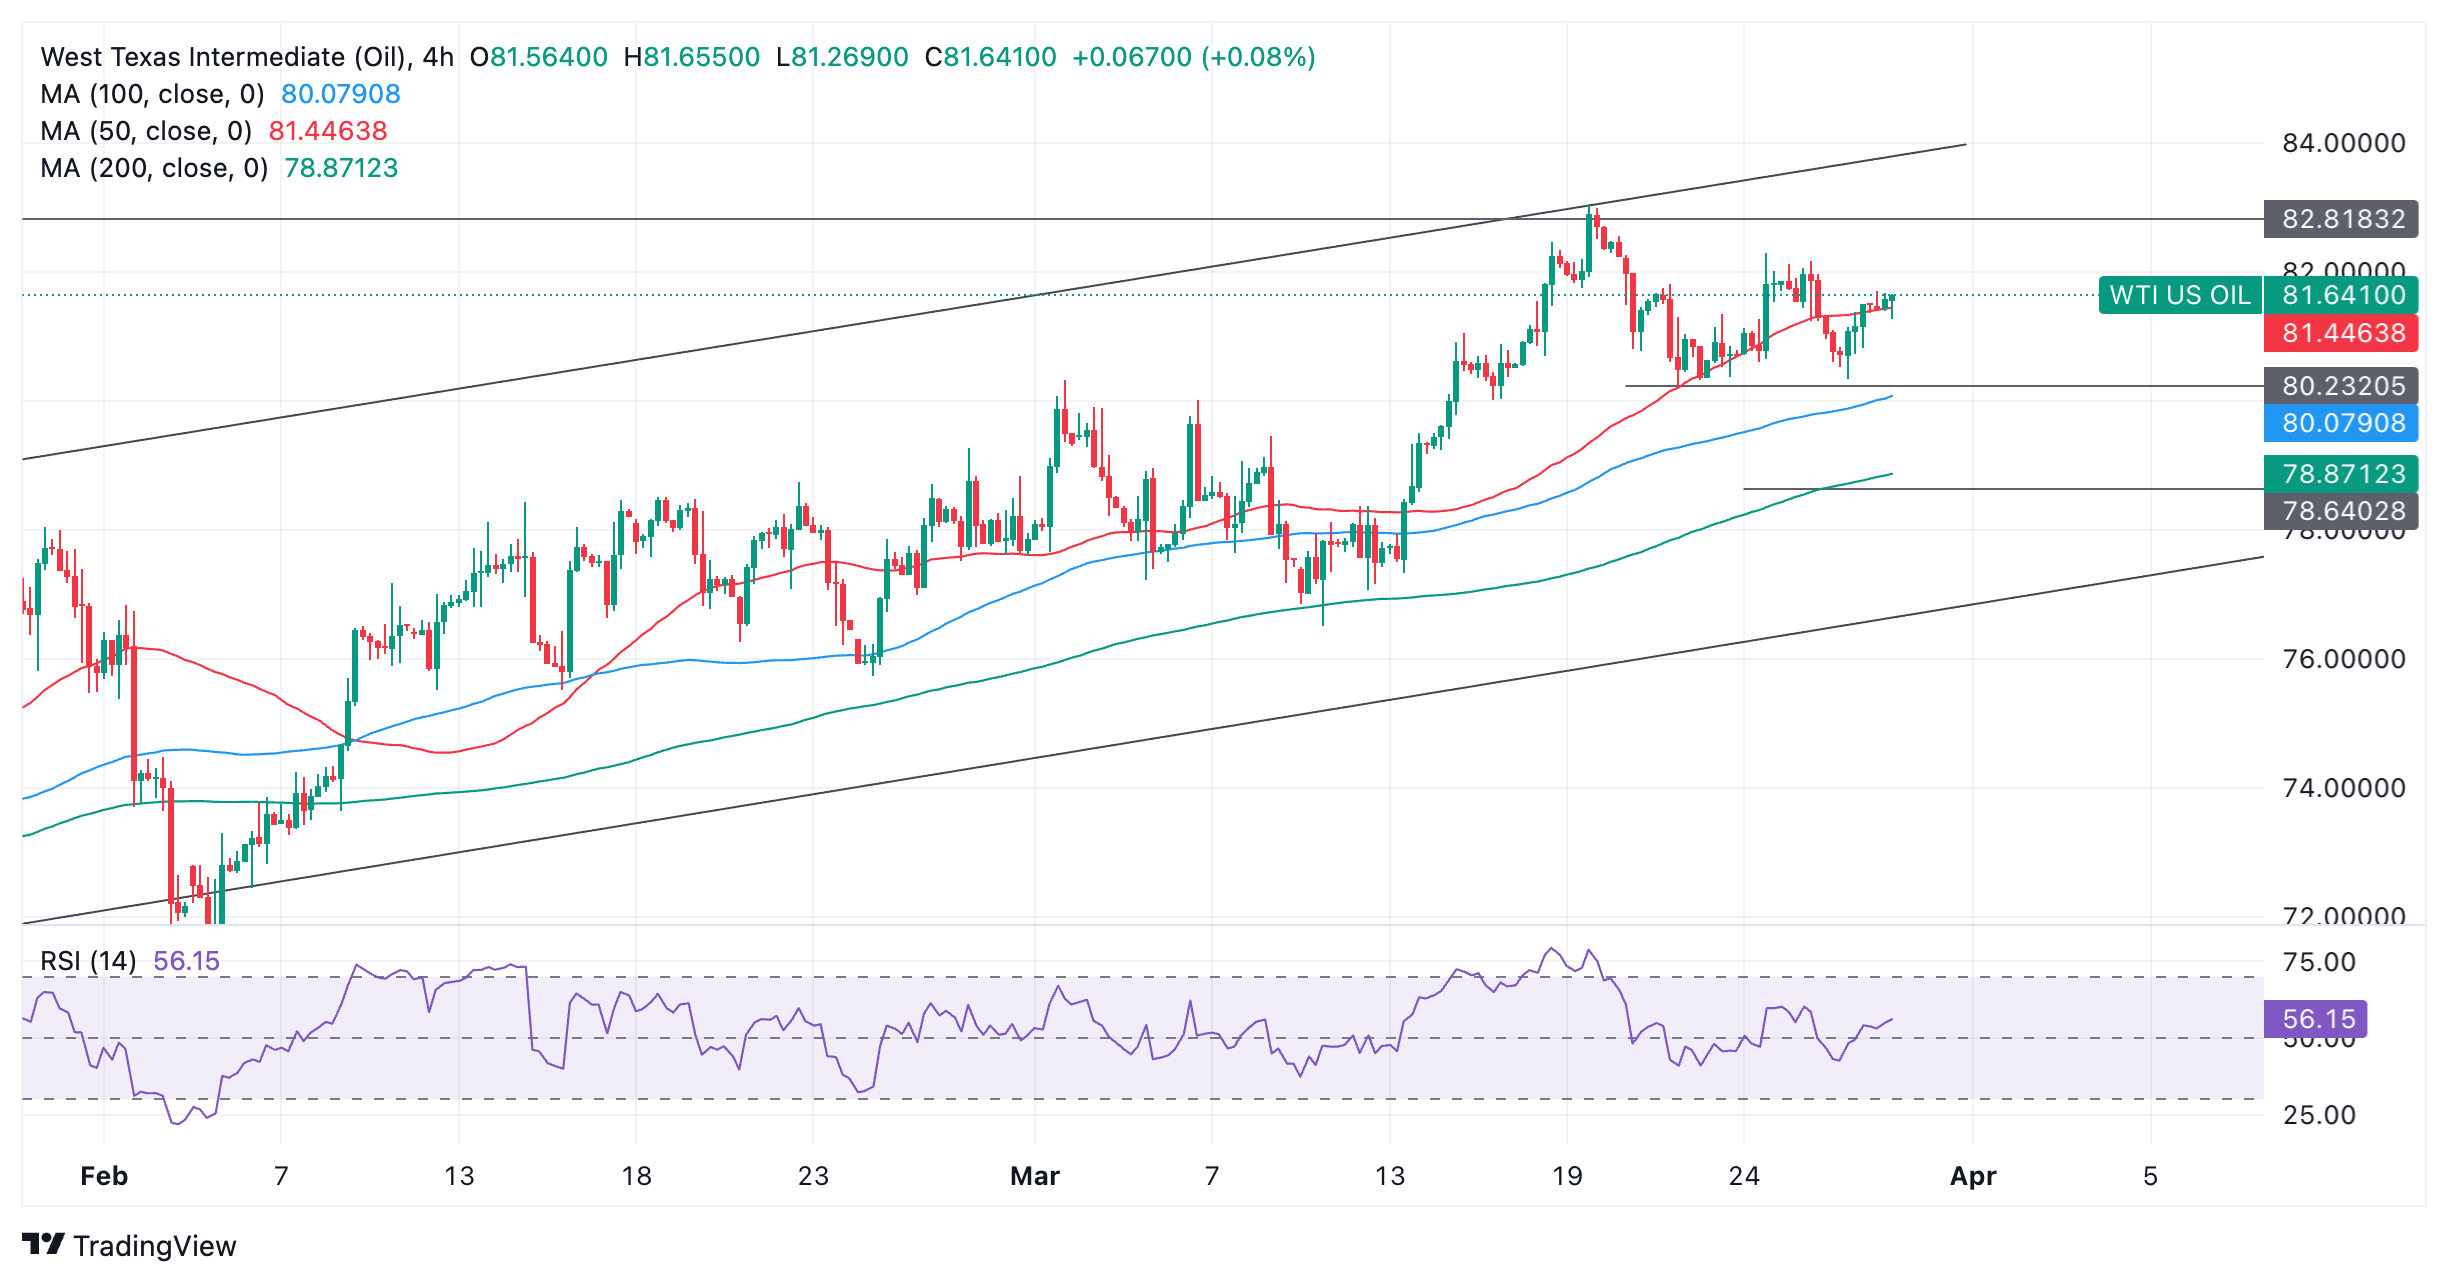
WTI Oil: 4-hour chart
The trend on longer time frames is less clear, suggesting some caution needs to be taken in adopting an overly bullish view.
On March 19, Oil price peaked at $83.05 before rolling over. A combination of resistance from the 100-week Simple Moving Average (SMA) (not shown) and the top of the price channel were probably the catalysts for the rejection.
Oil price has since yo-yoed in a range between roughly $80.20 and $82.00.
Although the pair retains its short-term uptrend intact it is at risk of reversing lower unless it can print a higher high.
A break below the $80.20 range lows would indicate peaks and troughs were now in a falling pattern rather than rising, and that the short-term trend was bearish. This would start to push the odds in favor of bearish bets.
Such a move would probably lead to a decline back down within the channel to an initial target at $78.60-80 where a combination of major Moving Averages converge, supplying dynamic support for the commodity.
Alternatively a break above the $83.05 highs would indicate a continuation of the short-term uptrend, with the next possible target in the upper $83.00s, perhaps $83.90 to put a number on it.
Forex News
Keep up with the financial markets, know what's happening and what is affecting the markets with our latest market updates. Analyze market movers, trends and build your trading strategies accordingly.