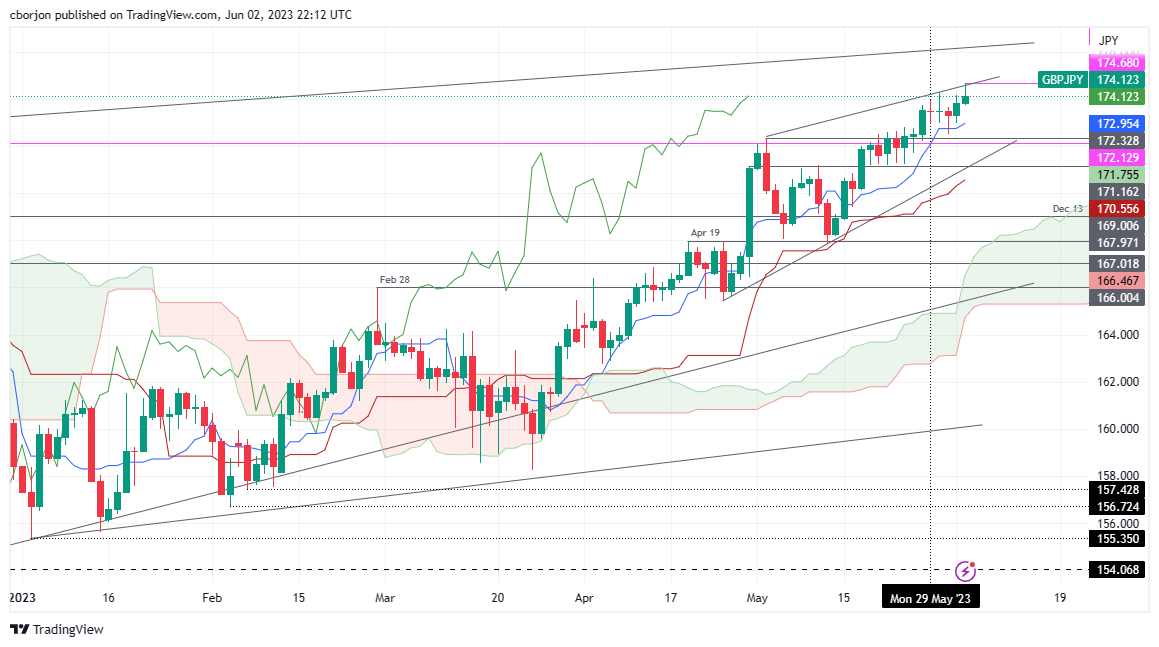
GBP/JPY Price Analysis: Hits YTD highs on risk-on sentiment, retraces as a rising wedge forms
- GBP/JPY surges to year's high, up by 0.18%, amid positive market sentiment.
- Expectations of a dovish Fed and resolution of the US debt-ceiling imbue strength to high beta currencies.
- Despite the overall upward bias, the technical outlook suggests potential downside pressure on GBP/JPY.
GBP/JPY climbed to fresh year-to-date (YTD) highs at 174.68 before a pullback that dragged the exchange rate toward the 174.10s area. A risk-on impulse caused expectations for a dovish US Federal Reserve (Fed) amongst geopolitical issues like the US debt-ceiling resolution underpinned high beta currencies. Therefore, safe-haven peers persisted pressured, as the GBP/JPY traded at 174.12, up 0.18%.
GBP/JPY Price Analysis: Technical outlook
The GBP/JPY is still upward biased, confirmed by price action widening its distance from the Tenkan-Sen and Kijun-Sen lines below the exchange rate. In addition, price action is another bullish signal above the Ichimoku cloud.
Nevertheless, an upslope resistance trendline from the May 2 highs cushioned the GBP/JPY rally; while a support trendline, drawn from the April and May lows, indicates a rising wedge forming. That means further downside pressure is expected.
If GBP/JPY falls below the 174.00 figure, the next support would be the Tenkan-Sen at 172.95. A breach of the latter will expose the 2022 high turned support at 172.13 before testing April 28 daily high at 171.16. Conversely, the uptrend would continue above the YTD high at 174.68 once cleared, and the GBP/JPY could rally to the 175.00 mark, followed by the 2016 high at 177.37.
GBP/JPY Price Action – Daily chart

Forex News
Keep up with the financial markets, know what's happening and what is affecting the markets with our latest market updates. Analyze market movers, trends and build your trading strategies accordingly.
