Crude Oil falls, WTI back below $79.00 and threatens to sink back into congestion
- Overextended Crude Oil markets retreat despite OPEC extension.
- Markets are taking profits and pulling back bids.
- Fed rate expectations and no-OPEC production caps gains.
West Texas Intermediate (WTI) US Crude Oil softened on Monday, testing below $79.00 per barrel and markets pull back from the recent bullish pop out of near-term congestion that has seen barrel bids grind slowly higher.
The Organization of the Petroleum Exporting Countries (OPEC) formally announced that they would be extending Q1 production cuts through the second quarter, and possibly longer if needed. Markets have largely priced in the production cap extension from OPEC, and the announcement failed to generate bullish momentum in Crude Oil.
Key non-OPEC Crude Oil producers, specifically the US, have continued to outperform market expectations. The US is producing record amounts of Crude Oil, and US Crude oIl stocks have been swamping refinery supply lines recently, keeping topside Crude Oil momentum limited.
Markets continue to get pushed further down the calendar on Federal Reserve (Fed) rate cut expectations, keeping risk appetite pinned on the lower side, helping to force down barrel bids. Markets are also becoming inured to geopolitical headlines from both the Gaza conflict between Israel and Hamas, and supply line concerns stemming from Houthi rebel attacks in the Red Sea are becoming normalized.
WTI technical outlook
Monday’s bearish pulldown in WTI US Crude Oil saw barrel shed the $79.00 handle, and price pressures are pointed to the downside despite recent price action grinding higher from last week’s swing low into $76.00.
Daily candles are drifting back into touch range of the 200-day Simple Moving Average (SMA) at $77.75, WTI bidders have a growing hill to climb over as bids tumble back below January’s peak at $79.20.
WTI hourly chart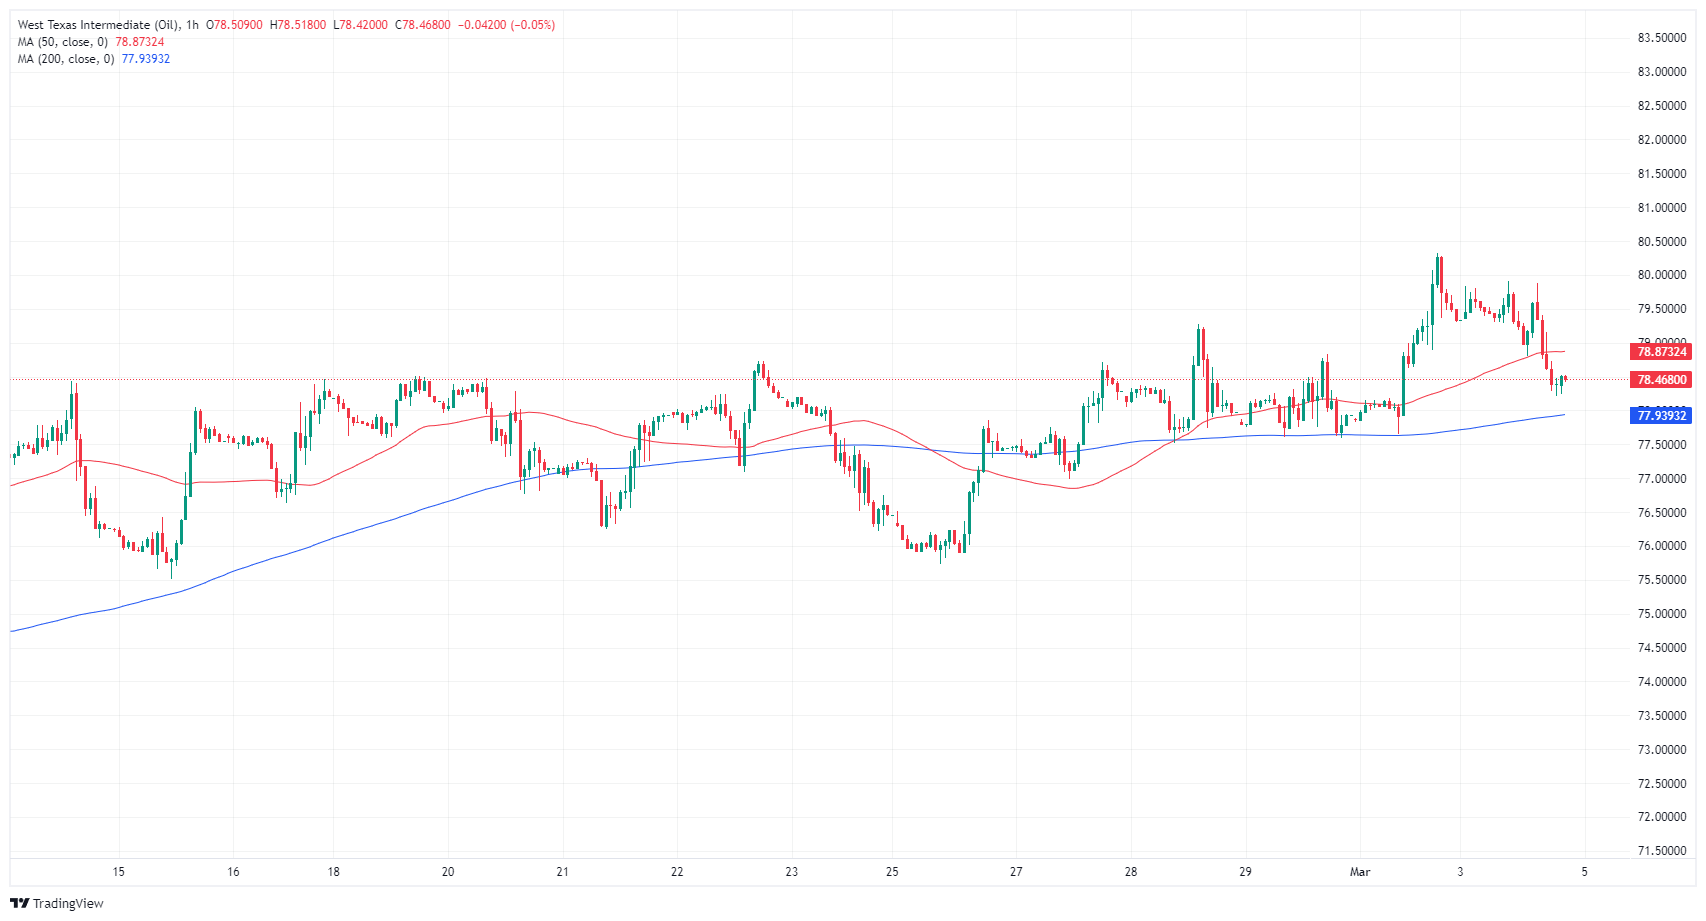
WTI daily chart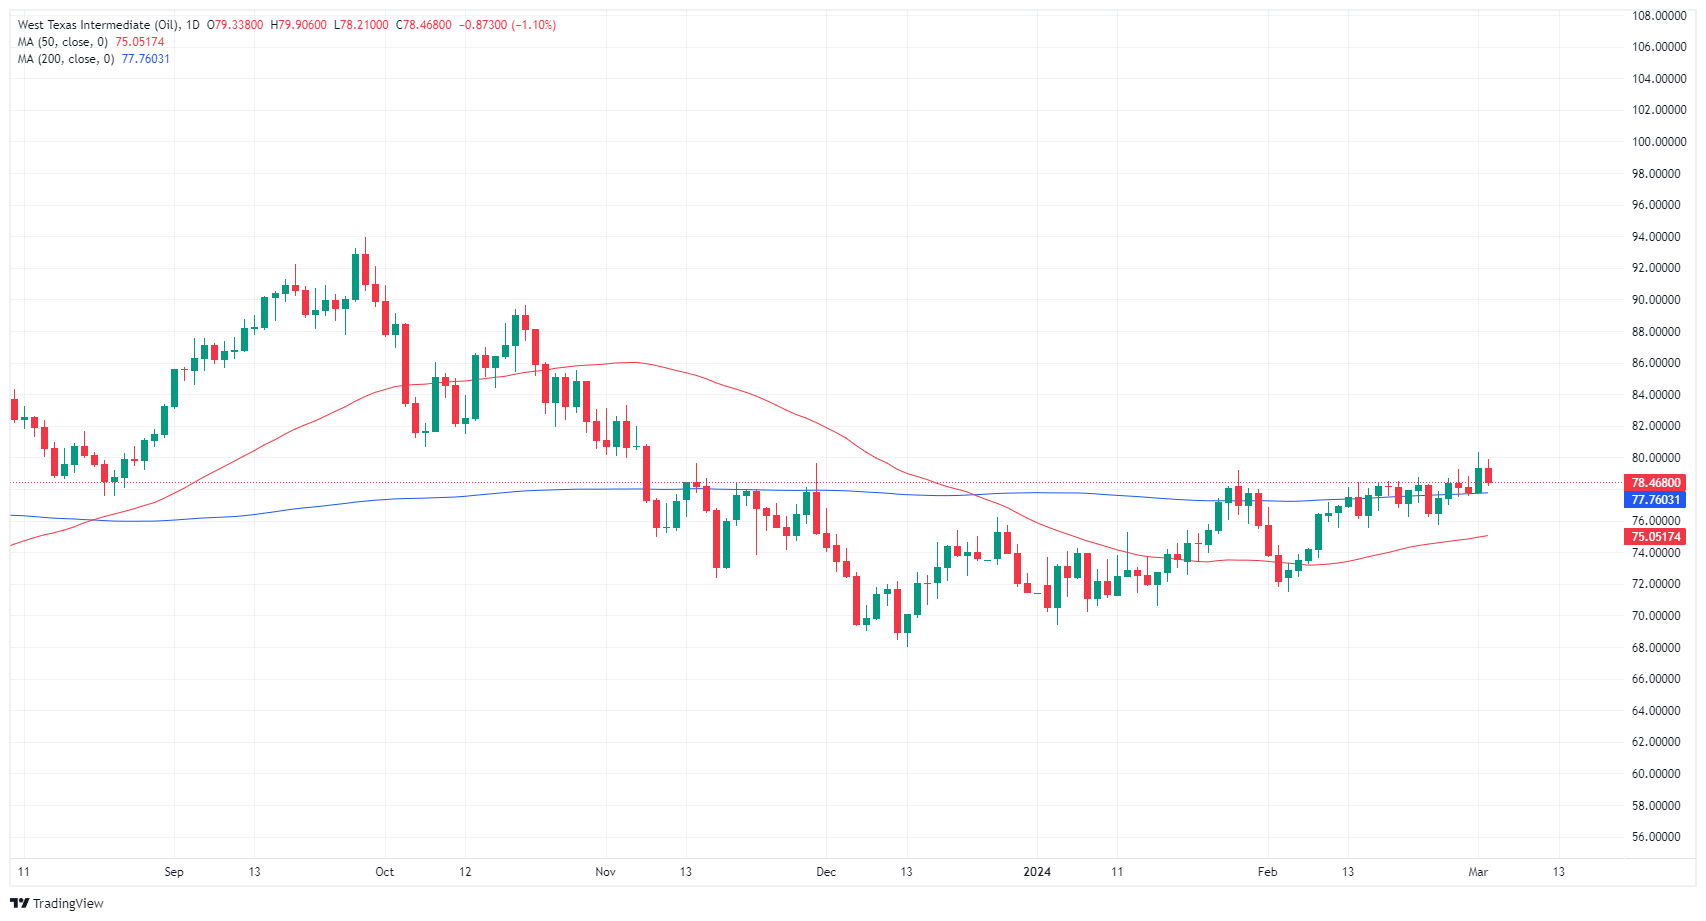
Forex News
Keep up with the financial markets, know what's happening and what is affecting the markets with our latest market updates. Analyze market movers, trends and build your trading strategies accordingly.