
XAU/USD tests above $2,100 as markets bet on June Fed rate cut
- Spot Gold prices are on the rise on Monday.
- Markets are expecting Fed rate cuts after middling data.
- XAU/USD pushes back into all-time high territory.
XAU/USD rose above $2,100.00 on Monday as markets lean into Spot Gold bids. Investors are ramping up bets of a June rate cut from the Federal Reserve (Fed) after US economic data middled to softened last week.
Markets are jostling into risk-taking position ahead of this week’s key US Nonfarm Payrolls (NFP) report coming up on Friday. Traders will be looking for a softer labor figure to add to the rate cut puzzle, and broad-market hopes for a weakening US economic outlook are crystallizing into XAU/USD buying.
This week also sees the US ADP Employment Change for February as a labor data preview of Friday’s NFP, albeit one with a shaky connection in recent history. Fed Chairman Jerome Powell will also be speaking on Wednesday, testifying before the Financial Services Committee about the Semi-Annual Monetary Policy Report beginning at 15:00 GMT.
US economic data will kick the week off with Tuesday’s ISM Services Purchasing Managers Index for February, expected to soften to 53.0 from January’s 53.4.
XAU/USD technical outlook
Spot Gold is extending last Friday’s gains, tipping over the $2,100.00 handle in the early week’s trading. XAU/USD is up over a full percent bottom-to-top on Monday, and intraday bids are accelerating into the high end away from the 200-hour Simple Moving Average (SMA) at $2,038.89.
Daily candlesticks are on approach to all-time highs set in December at $2,144.48, and XAU/USD has climbed around 4% from last week’s low bids near $2,025.00.
XAU/USD hourly chart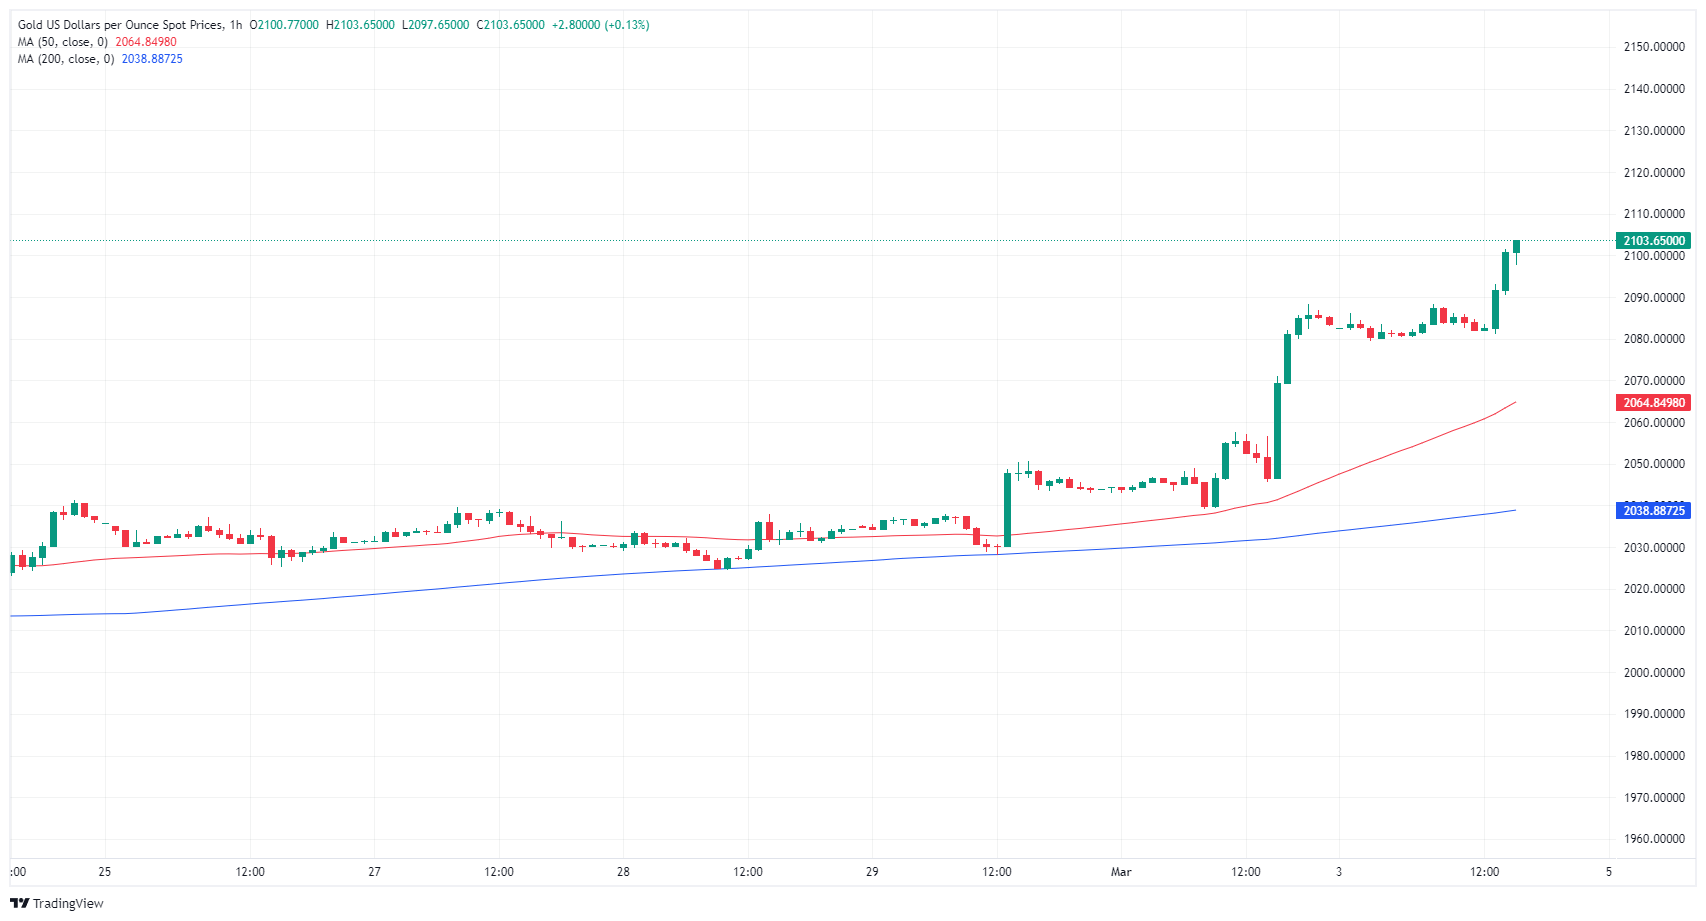
XAU/USD daily chart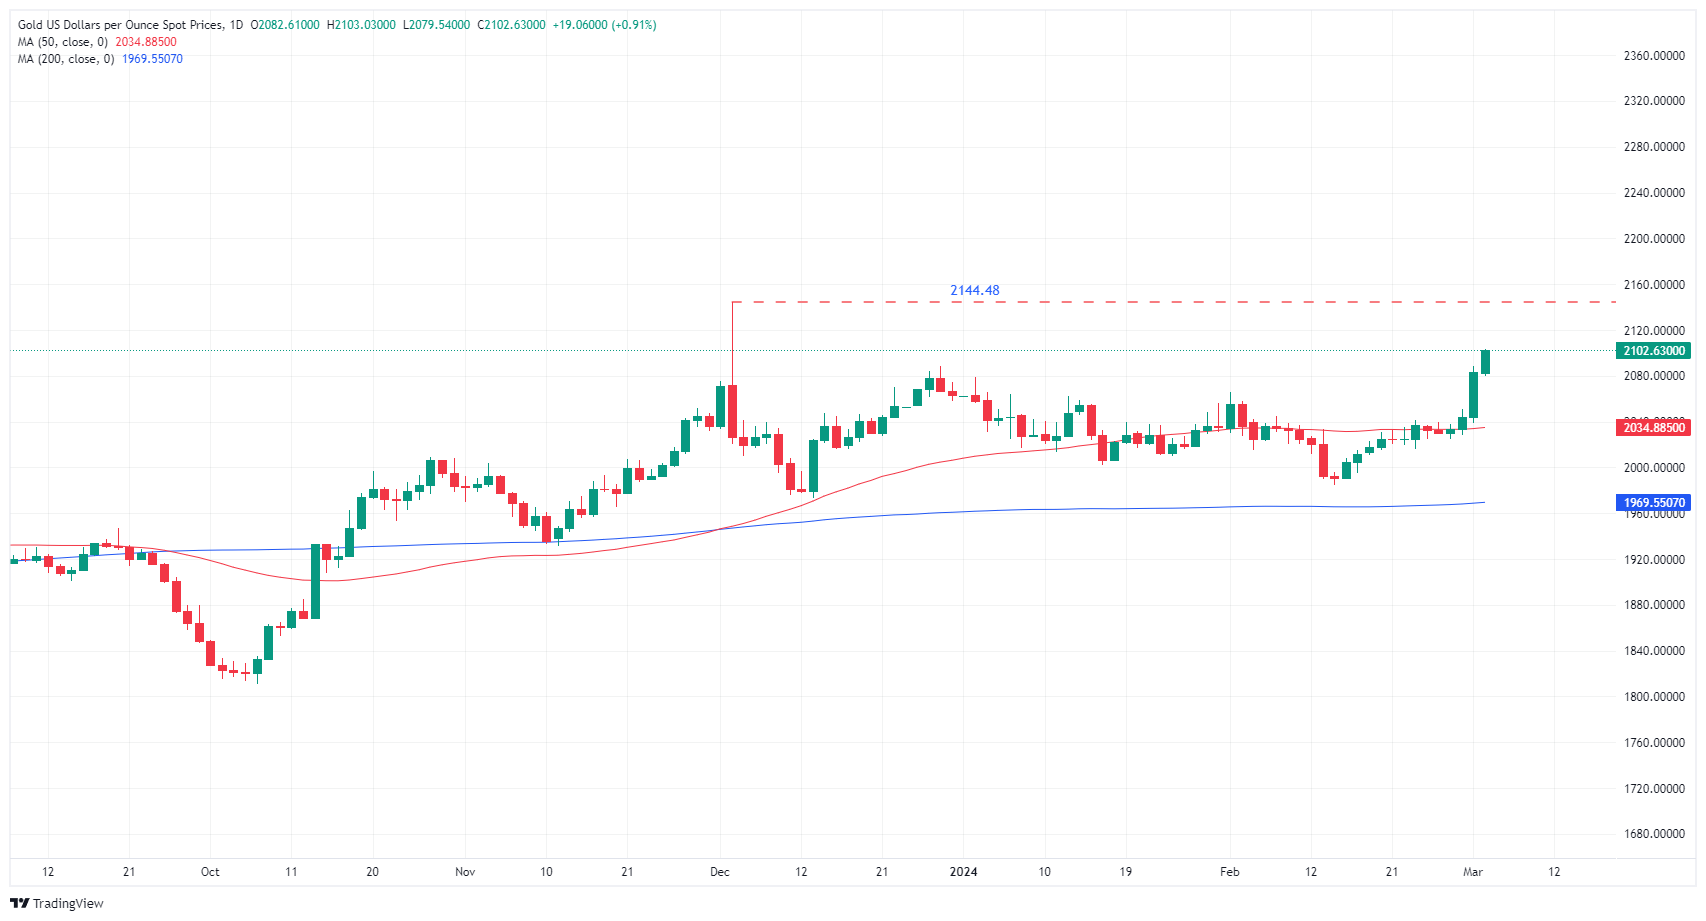
Forex News
Keep up with the financial markets, know what's happening and what is affecting the markets with our latest market updates. Analyze market movers, trends and build your trading strategies accordingly.