Natural Gas Price Analysis: XNG/USD eyes further downside, $2.31 is the key for bear’s conviction
- Natural Gas price prints the first daily loss in four, retreats from one-week high.
- XNG/USD eases from three-week-old descending resistance line, 100-SMA.
- Weekly support line, 200-SMA prods Natural Gas sellers before giving them control.
- Easing bullish bias of MACD, RSI (14) line’s retreat keep XNG/USD bears hopeful.
Natural Gas (XNG/USD) Price remains pressured around $2.34 during the first loss-making day in four amid early Wednesday.
In doing so, the energy instrument marks a U-turn from a downward-sloping resistance line from April 19, 2023, as well as a decline below the 100-SMA.
That said, the receding bullish bias of the MACD and the RSI (14) retreat adds strength to the pullback moves of the Natural Gas price.
As a result, the XNG/USD is likely to break the weekly support line, around $2.34 by the press time.
Following that, the 200-SMA level of around $2.31 can act as the last defense of the Natural Gas buyers, a break of which won’t hesitate to challenge the monthly low of around $2.14.
Meanwhile, an upside clearance of the 100-SMA and the aforementioned resistance line, respectively near $2.37 and $2.40 can recall the Natural Gas buyers targeting the previous monthly high of around $2.58.
It’s worth noting that the XNG/USD price remains unconvincing to Natural Gas buyers unless the quote remains firmer past the mid-March swing high of around $2.75.
Overall, the Natural Gas Price is likely to remain depressed despite the latest sluggish moves.
Natural Gas Price: Four-hour chart
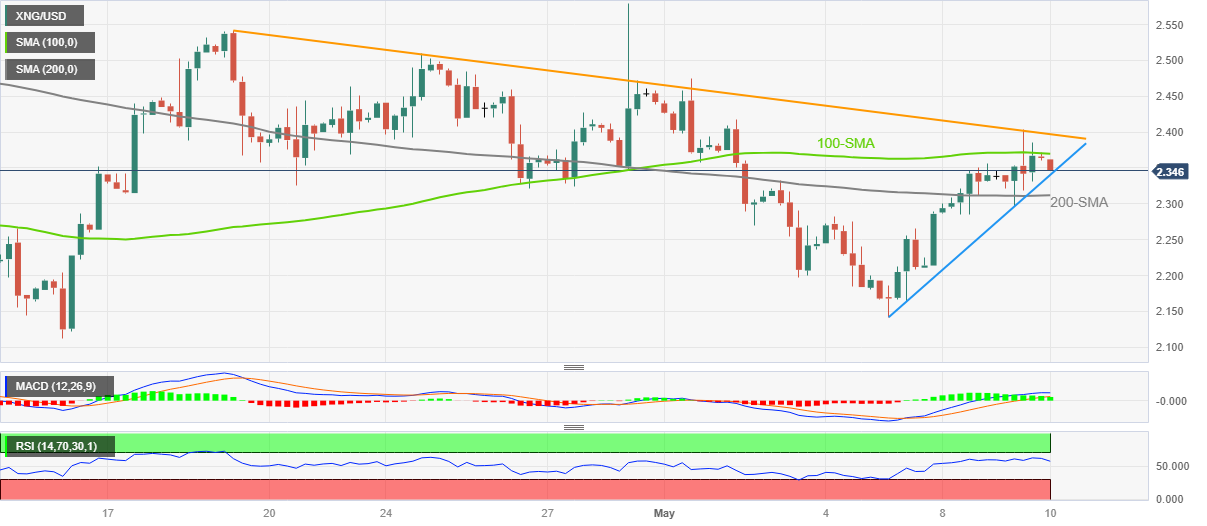
Trend: Further weakness expected
Forex News
Keep up with the financial markets, know what's happening and what is affecting the markets with our latest market updates. Analyze market movers, trends and build your trading strategies accordingly.