AUD/JPY Price Analysis: Bullish sentiment persists, indicators point to weak momentum
- The AUD/JPY is trading at 98.04, marking a 0.12% gain during Monday's session.
- The RSI on both daily and hourly charts is in the positive zone, but momentum is limited.
- The overall trend remains bullish as the buyers recovered the 20-day SMA.
In Monday's session, the AUD/JPY pair is trading at 98.04, reflecting a 0.12% gain. Despite a slight decrease in buying momentum, there's an overall moderate bullish sentiment dominating the market as indicators seem to recover after recent declines.
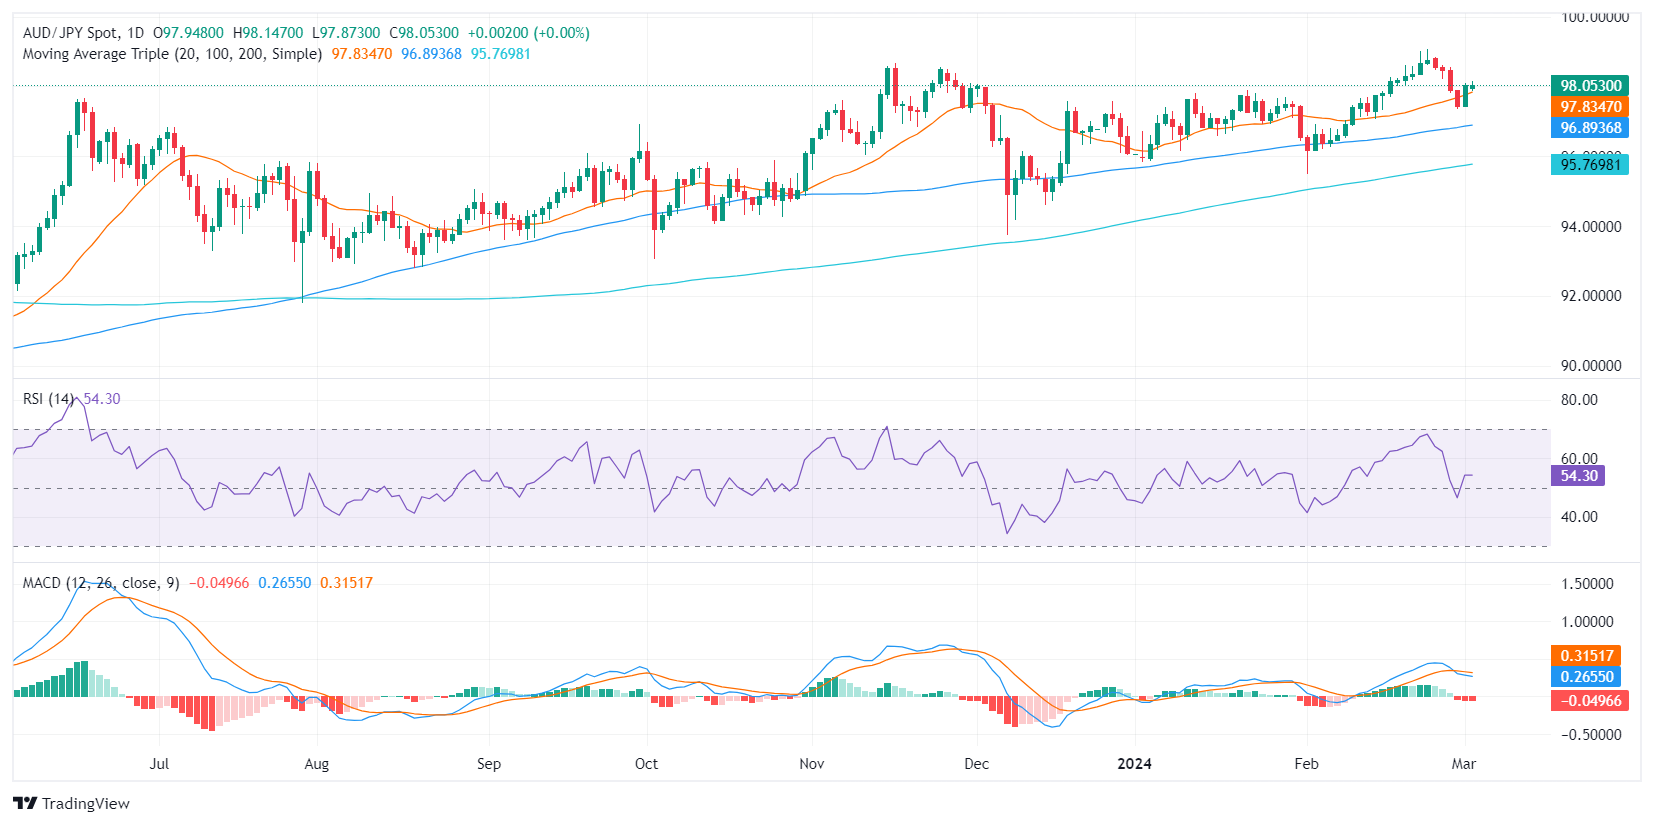
On the daily chart, the AUD/JPY pair's Relative Strength Index (RSI) is currently in positive territory, indicating that buyers have had the edge recently after diving below 50. Despite slight decreases in the latest readings, there's still a moderate bullish momentum. The Moving Average Convergence Divergence (MACD) histogram shows flat red bars, suggesting a loss in positive momentum but a still mildly bullish sentiment in the market.
AUD/JPY daily chart
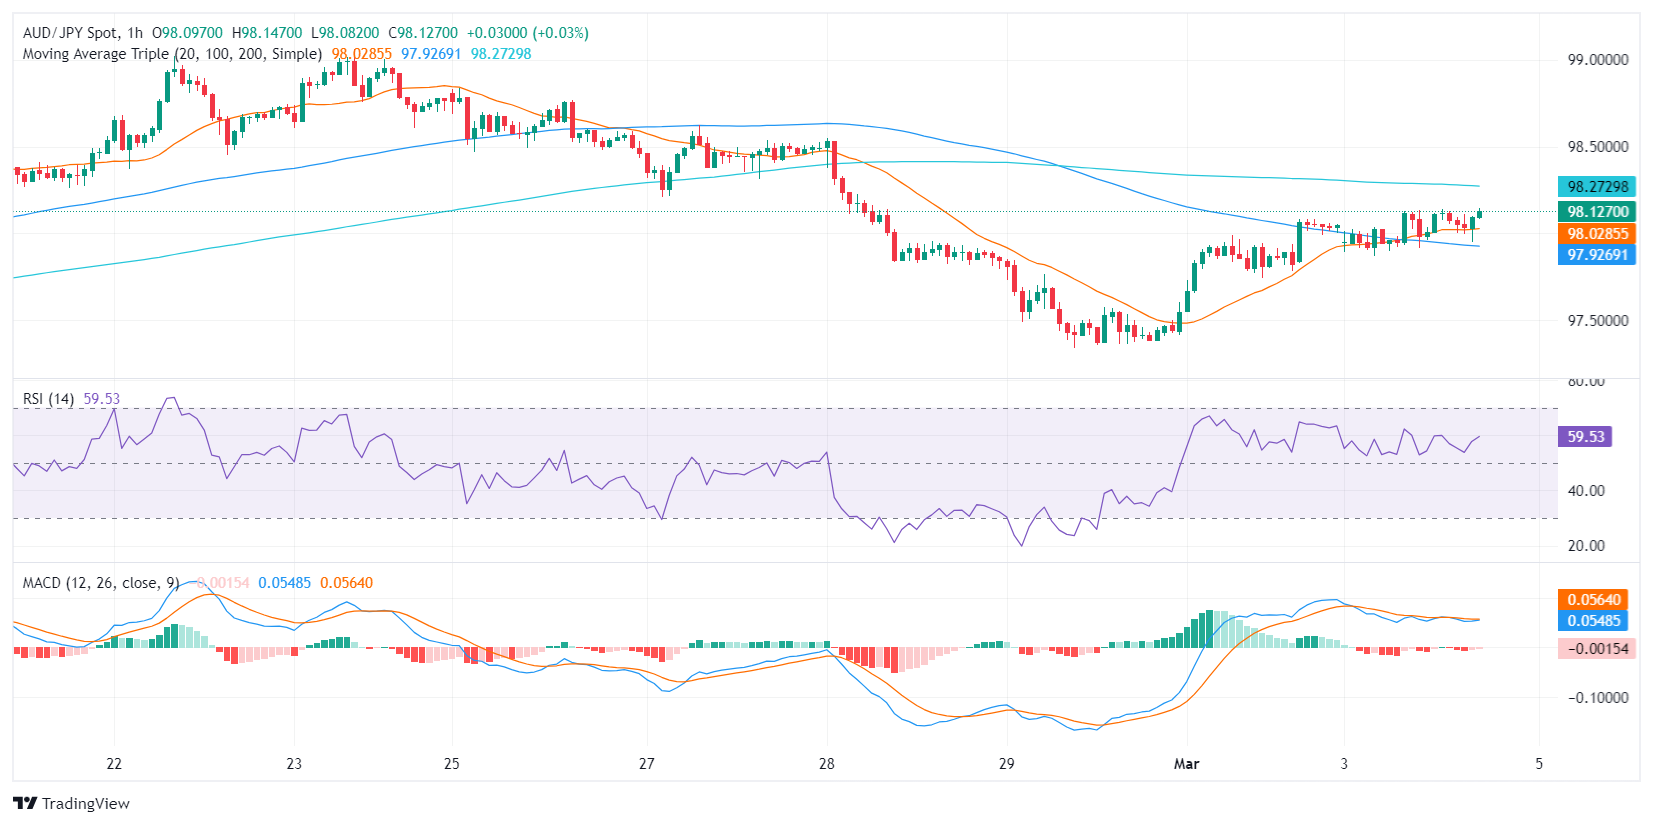
Switching to the hourly chart, the RSI values present a similar picture, hovering in the positive territory, and the MACD histogram continues with red decreasing bars, indicating a loss in selling momentum but a flattened buying traction. The readings imply that the pair is experiencing similar dynamics on a shorter-term scale.
AUD/JPY hourly chart
By contrasting the daily and hourly charts, indicators suggest a consistent bullish momentum, albeit with decreased intensity. Despite the short-term neutral-to-negative outlook, the pair's position above the 20, 100, and 200-day Simple Moving Averages (SMAs) reinforces the perspective that buyers are in control in a broader market view.
Forex News
Keep up with the financial markets, know what's happening and what is affecting the markets with our latest market updates. Analyze market movers, trends and build your trading strategies accordingly.