EUR/USD drops as US Dollar rebounds after investors digest Fed rate-cut prospects
- EUR/USD fails to hold gains near 1.0780 as US Dollar rebounds despite firm Fed rate-cut speculation.
- Easing US labor market conditions strengthens Fed rate-cut prospects.
- The ECB is projected to deliver three rate cuts this year due to easing Eurozone inflation.
EUR/USD faces selling pressure near 1.0800 in Friday’s American session. The major currency pair fails to hold strength as investors expect that the European Central Bank (ECB) will start lowering its borrowing rates in June.
However, ECB policymakers are divided over extending the rate-cut cycle after the June meeting. A few policymakers believe that additional interest rate cuts from the July meeting could revamp price pressures.
ECB policymaker and Bank of Greece Governor Yannis Stournaras said in an interview with a Greek media outlet last week that he sees three rate cuts this year. He sees a rate cut in July as possible and added that an economic rebound in the first quarter made a three-cuts scenario more likely than four. The Eurozone economy expanded by 0.3% in the January-March period, beating expectations of a 0.1% growth.
On the contrary, ECB Governing Council member and Governor of Austria's central bank, Robert Holzmann, said on Wednesday that he doesn't see a reason to cut key interest rates "too quickly or too strongly," Reuters reported.
This week, EUR/USD has been driven by market sentiment due to the absence of tier-1 Eurozone and United States economic data. However, next week, investors will focus on the US Consumer Price Index (CPI) data for April, which will be published on Wednesday.
Daily digest market movers: EUR/USD faces pressure as US Dollar recovers
- EUR/USD finds significant offers near the round-level resistance of 1.0800 as the US Dollar rebounds. Investors digest firm speculation that the Federal Reserve (Fed) will start reducing interest rates in September.
- Expectations for the Fed to begin lowering interest rates in September strengthened as the US labor market showed further signs of cooling. On Thursday, the US Department of Labor reported that Initial Jobless Claims rose significantly to 231K (the highest level since November 10 week), exceeding the consensus of 210K and the prior reading of 209K.
- Apart from the higher-than-expected jobless claims, weak Nonfarm Payrolls (NFP) for April and slower job openings in March have dented investors’ confidence in the strength of the US labor market. Job growth was the lowest in six months and job postings were the lowest in three years.
- Cooling US labor market conditions indicate that the job market is struggling to bear the burden of the Fed’s restrictive monetary policy framework. The context has boosted Fed interest rate-cut prospects for September. The CME FedWatch tool shows that traders see a 71% chance that interest rates will decline from their current levels in September, which is higher than the odds of 66% recorded a month ago.
- This week, Minneapolis Fed Bank President Neel Kashkari said that weakness in the job market could justify a rate cut. However, he remained lean towards maintaining the current interest rate framework for the entire year. Kashkari signalled concerns over stalling progress in inflation declining to 2% amid a strong housing market.
Technical Analysis: EUR/USD falls from 1.0800
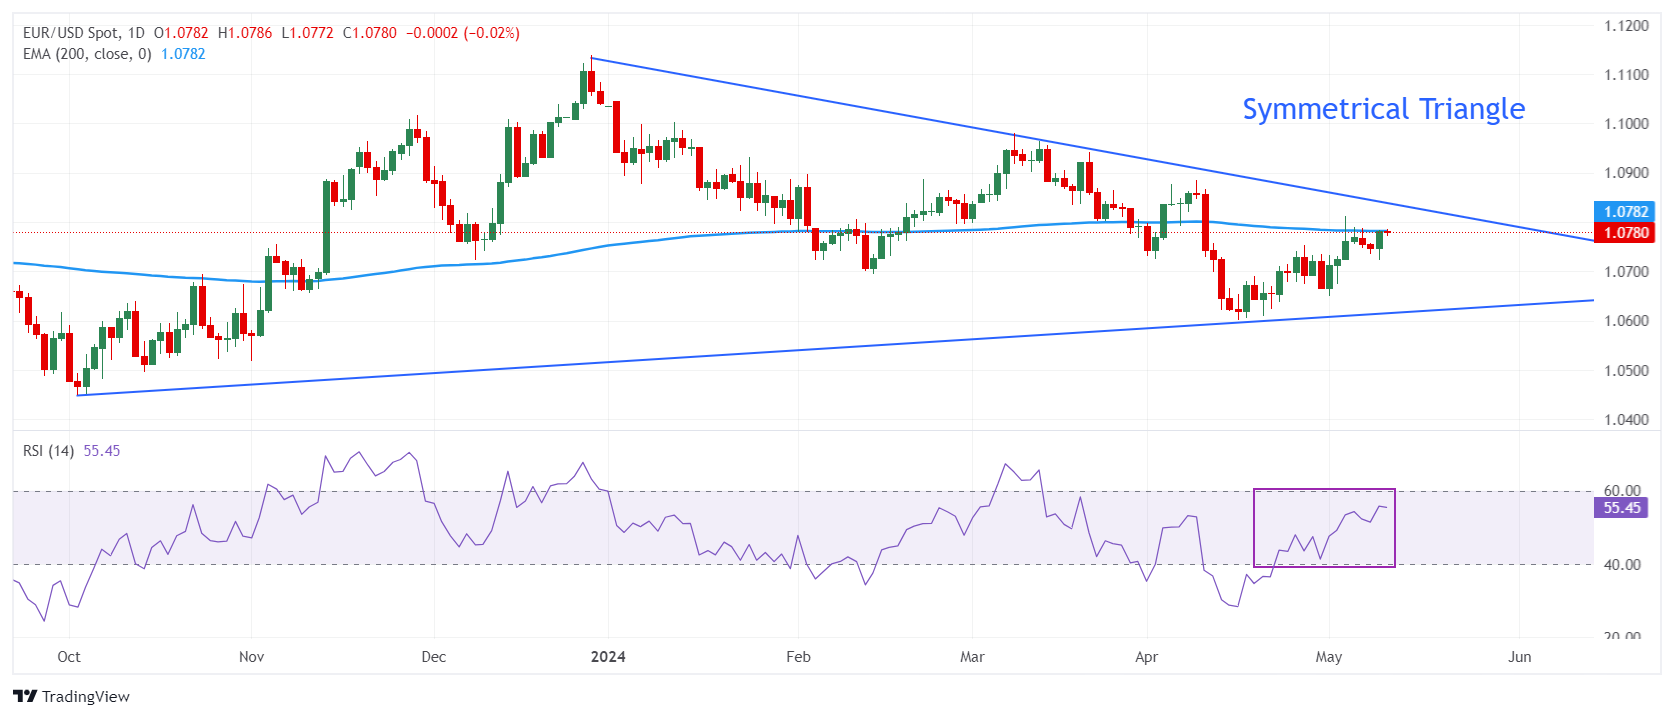
EUR/USD is steadily approaching the downward-sloping border of a Symmetrical Triangle pattern formed on a daily time frame, which is plotted from December 28 high around 1.1140. The upward-sloping border of the triangle pattern is marked from the October 3 low at 1.0448. The Symmetrical Triangle formation exhibits a sharp volatility contraction.
The major currency pair has come closer to the 200-day Exponential Moving Average (EMA), which trades around 1.0780.
The 14-period Relative Strength Index (RSI) oscillates inside the 40.00-60.00 range, suggesting indecisiveness among market participants.
Economic Indicator
Consumer Price Index (YoY)
Inflationary or deflationary tendencies are measured by periodically summing the prices of a basket of representative goods and services and presenting the data as The Consumer Price Index (CPI). CPI data is compiled on a monthly basis and released by the US Department of Labor Statistics. The YoY reading compares the prices of goods in the reference month to the same month a year earlier.The CPI is a key indicator to measure inflation and changes in purchasing trends. Generally speaking, a high reading is seen as bullish for the US Dollar (USD), while a low reading is seen as bearish.
Read more.Next release: Wed May 15, 2024 12:30
Frequency: Monthly
Consensus: 3.4%
Previous: 3.5%
Source: US Bureau of Labor Statistics
The US Federal Reserve has a dual mandate of maintaining price stability and maximum employment. According to such mandate, inflation should be at around 2% YoY and has become the weakest pillar of the central bank’s directive ever since the world suffered a pandemic, which extends to these days. Price pressures keep rising amid supply-chain issues and bottlenecks, with the Consumer Price Index (CPI) hanging at multi-decade highs. The Fed has already taken measures to tame inflation and is expected to maintain an aggressive stance in the foreseeable future.
Forex News
Keep up with the financial markets, know what's happening and what is affecting the markets with our latest market updates. Analyze market movers, trends and build your trading strategies accordingly.