USD/JPY Price Analysis: Climbs toward 154.00 after bouncing off the 50-DMA
- USD/JPY climbs over 0.60% from two-week low, as positive sentiment reduces yen's safe-haven appeal.
- Hammer candlestick at 152.97 on Friday signals potential upward momentum.
- Resistance seen at 154.00, with further targets at 155.52 (Tenkan-Sen) and 155.78 (Senkou Span A).
The USD/JPY bounced off a two-week low and climbed toward the 153.90ish area, shy of decisively cracking the 154.00 mark. It is trading with gains of more than 0.60%. The market sentiment is upbeat, a headwind for safe-haven currencies like the Japanese Yen (JPY).
USD/JPY Price Analysis: Technical outlook
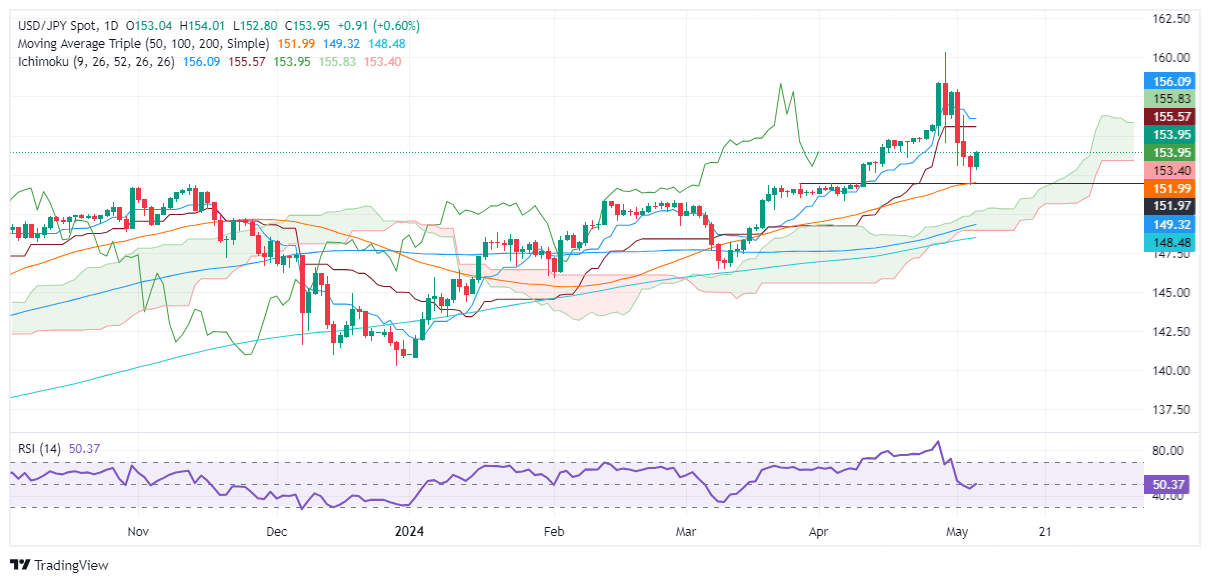
The USD/JPY remains upward biased. On Friday, the pair hit the two-week low of 151.99, though finished the session at 152.97, forming a ‘hammer,’ a candlestick chart pattern. This chart pattern is bullish when preceded by a downtrend, but it needs to be followed by a candle that breaches the ‘hammer’s’ high.
With that said, the USD/JPY cleared the May 3 high at 153.80, opening the door for further gains. Therefore, the first resistance would be the 154.00 mark. Once cleared, up next would be the Tenkan-Sen at 155.52, followed by the Senkou Span A at 155.78. Further gains are seen at 156.05.
For a bearish resumption, sellers must clear the 50-DMA at 151.99, which could pave the way to testing the following lowest low at 150.81.
USD/JPY Price Action – Daily Chart
Forex News
Keep up with the financial markets, know what's happening and what is affecting the markets with our latest market updates. Analyze market movers, trends and build your trading strategies accordingly.