-
Opps!
This language contents are not available!
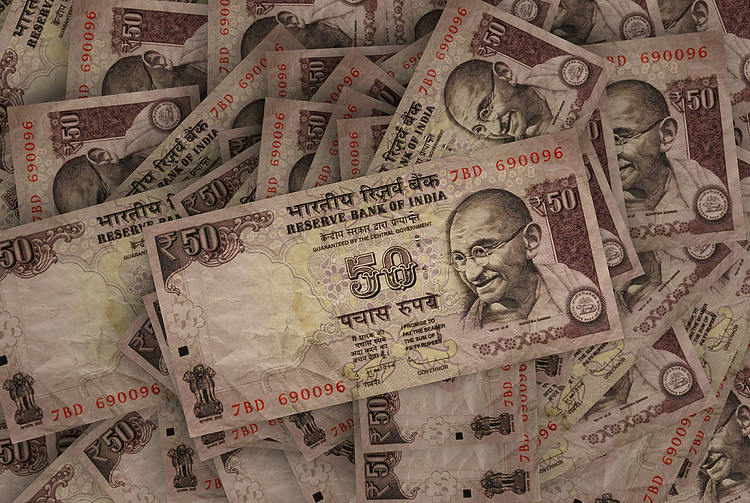
USD/INR rises to near 83.50 due to the upward correction in the US Dollar
- USD/INR gains ground as US Treasury yields recover on Thursday.
- The US Dollar may struggle due to the growing expectations of multiple rate cuts by the Fed in 2024.
- India's Trade Deficit increased to $19.1 billion in April due to lower exports and a rise in Gold imports.
The USD/INR pair edges higher to near 83.50 during the early European session on Thursday. The upward correction in the US Dollar (USD) helps the pair to retrace its recent losses registered in the last two days. However, the Greenback depreciated on Wednesday due to growing expectations of multiple rate cuts by the Federal Reserve (Fed) in 2024.
This dovish sentiment surrounding the Fed was bolstered after the release of the lower-than-expected monthly Consumer Price Index (CPI) and Retail Sales data from the United States (US). US CPI decelerated to 0.3% month-over-month in April and came in at a lower-than-expected 0.4% reading. While Retail Sales flattened, falling short of the expected increase of 0.4%.
The US Dollar Index (DXY), which gauges the performance of the US Dollar (USD) against six major currencies, hovers around 104.30. The improved US Treasury yields are providing support for the Greenback. The 2-year and 10-year yields on US Treasury bonds stand at 4.73% and 4.33, respectively, by the press time.
On Wednesday, India's Trade Deficit, released by the Ministry of Commerce and Industry, increased to $19.1 billion in April, from the previous reading of $15.6 billion. This increase could be attributed to lower exports and a surge in Gold imports, according to government data.
Reuters cited a foreign exchange trader at a private bank who suggested that the Indian National Rupee (INR) "should strengthen somewhat, but don't expect the movement to be very significant as the INR would continue to underperform amidst broad USD short positions buildup." Forward premiums on the USD/INR pair saw an uptick, with the one-year implied yield rising by 2 basis points to 1.70%, supported by lower US bond yields.
USD/INR
| Overview | |
|---|---|
| Today last price | 83.4965 |
| Today Daily Change | 0.0804 |
| Today Daily Change % | 0.10 |
| Today daily open | 83.4161 |
| Trends | |
|---|---|
| Daily SMA20 | 83.437 |
| Daily SMA50 | 83.2954 |
| Daily SMA100 | 83.1691 |
| Daily SMA200 | 83.1721 |
| Levels | |
|---|---|
| Previous Daily High | 83.6006 |
| Previous Daily Low | 83.4061 |
| Previous Weekly High | 83.6168 |
| Previous Weekly Low | 83.36 |
| Previous Monthly High | 83.906 |
| Previous Monthly Low | 82.9225 |
| Daily Fibonacci 38.2% | 83.4804 |
| Daily Fibonacci 61.8% | 83.5263 |
| Daily Pivot Point S1 | 83.348 |
| Daily Pivot Point S2 | 83.2798 |
| Daily Pivot Point S3 | 83.1535 |
| Daily Pivot Point R1 | 83.5424 |
| Daily Pivot Point R2 | 83.6687 |
| Daily Pivot Point R3 | 83.7368 |
Forex News
Keep up with the financial markets, know what's happening and what is affecting the markets with our latest market updates. Analyze market movers, trends and build your trading strategies accordingly.
