Silver Price Analysis: XAG/USD recovers after testing $27.00 psychological level
- Silver rebounds from $27.00, rising 0.38% amid increased buying interest.
- Remains bullish, trading between Fibonacci levels of $24.33 and $29.78.
- To gain further, needs to surpass 38.2% Fibonacci level at $27.70, targeting $28.00 and beyond.
Silver price registers modest gains despite rising US Treasury bond yields and a strong US Dollar. The grey metal dipped to $27.00 but climbed as buyers stepped in. The XAG/USD trades at $27.33, up by 0.38%.
XAG/USD Price Analysis: Technical outlook
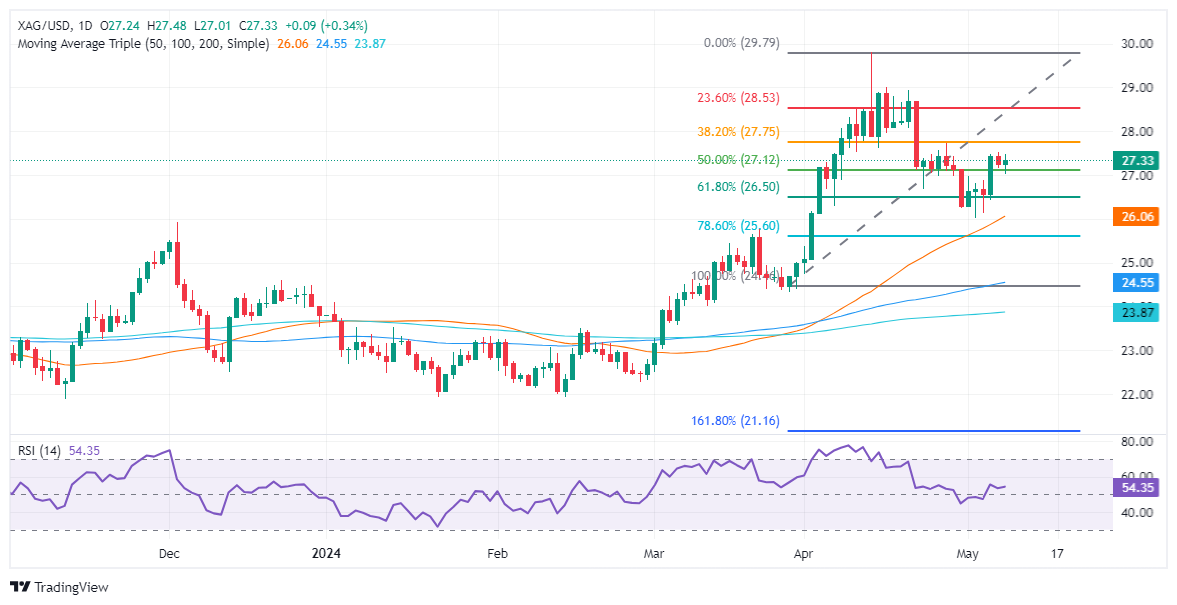
Silver remains upward biased, and it remains trading within the 50% and 38.2% Fibonacci retracements, drawn from the latest cycle low and high, each at $24.33 and $29.78, respectively.
The Relative Strength Index (RSI) is in bullish territory, indicating that momentum favors bulls. However, from a price action standpoint, buyers need to clear the 38.2% Fib retracement at $27.70 to challenge year-to-date (YTD) highs. Once surpassed, the next key resistance level would be the $28.00 psychological figure, followed by the 23.6% Fib retracement at $28.49 ahead of $29.00.
On the flip side, if sellers want to push prices lower, they must drag prices below the 50% Fib retracement at $27.05. Once done, sellers must clear $27.00, followed by the confluence of the May 2 low and the 50-day moving average (DMA) at $26.02/08.
XAG/USD Price Action – Daily Chart
Forex News
Keep up with the financial markets, know what's happening and what is affecting the markets with our latest market updates. Analyze market movers, trends and build your trading strategies accordingly.