USD/CHF gains ground above 0.9100, US PCE data looms
- USD/CHF trades in positive territory near 0.9130 on Friday.
- The US economy expanded at the slowest pace in two years, below the consensus.
- The escalating Middle East tensions might boost the safe-haven CHF.
The USD/CHF pair trades on a stronger note around 0.9130 during the early European session on Friday. The modest rebound of the US Dollar (USD) provides some support to the pair. Traders prefer to wait on the sideline ahead of the Swiss National Bank’s (SNB) Chairman Jordan speech, followed by the final reading of the US March Personal Consumption Expenditures Price Index (PCE) on Friday.
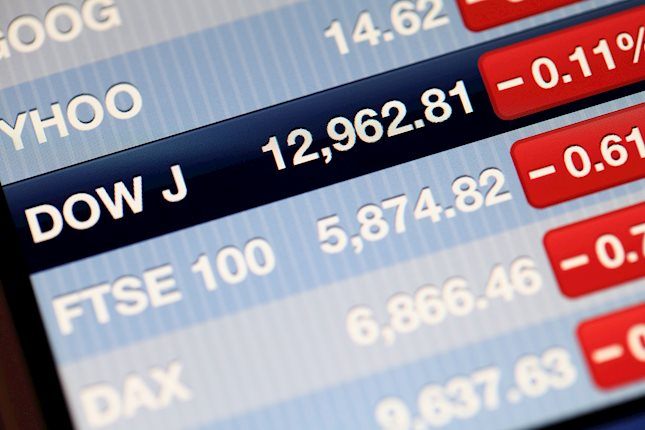
The US advance estimate of Gross Domestic Product (GDP) number grew far less than estimated in the first quarter of 2024, according to the Bureau of Economic Analysis on Thursday. The US economy grew at an annualized pace of 1.6% during the period, missing the expectation of 2.5% growth and coming in lower than fourth quarter GDP, which was revised up to 3.4%. The Greenback attracted some sellers after the data was released.
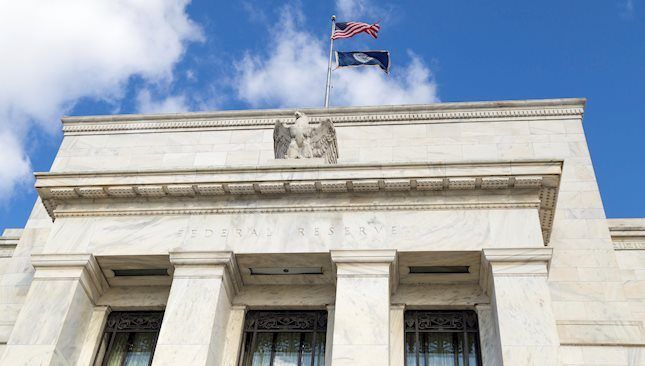
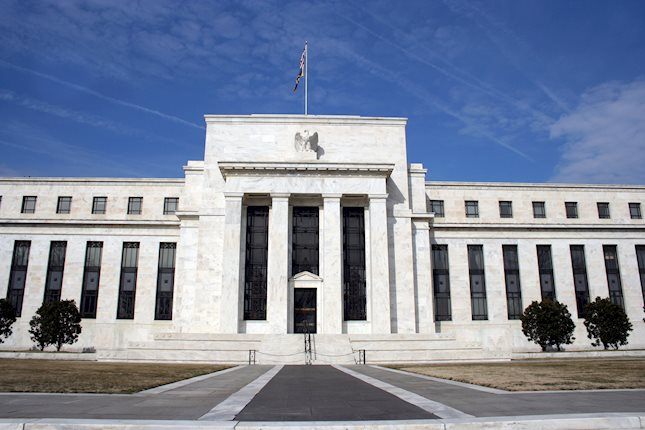
Nonetheless, a surprising upside in the quarterly Personal Consumption Expenditure (PCE) inflation measure suggested that the US Federal Reserve (Fed) would not cut interest rates before September. The PCE figure rose at an annualized rate of 3.4% in Q1, compared to the 1.8% pace recorded in Q4 2023. The recent inflation data dampened the hope for June rate cuts, and investors forecast one cut this year, down from three cuts just a few weeks ago. This, in turn, might cap the downside for the Greenback in the near term.
On the Swiss front, Switzerland’s ZEW Survey Expectations rose to 17.6 in April from the previous reading of 11.5, the Centre for European Economic Research revealed on Wednesday. Furthermore, the rising geopolitical tensions in the Middle East, particularly in Israel and Iran, might boost safe-haven asset flows, benefiting the Swiss Franc (CHF).
Forex News
Keep up with the financial markets, know what's happening and what is affecting the markets with our latest market updates. Analyze market movers, trends and build your trading strategies accordingly.