What is RSI Indicator? Overbought, Oversold, and How to Trade It
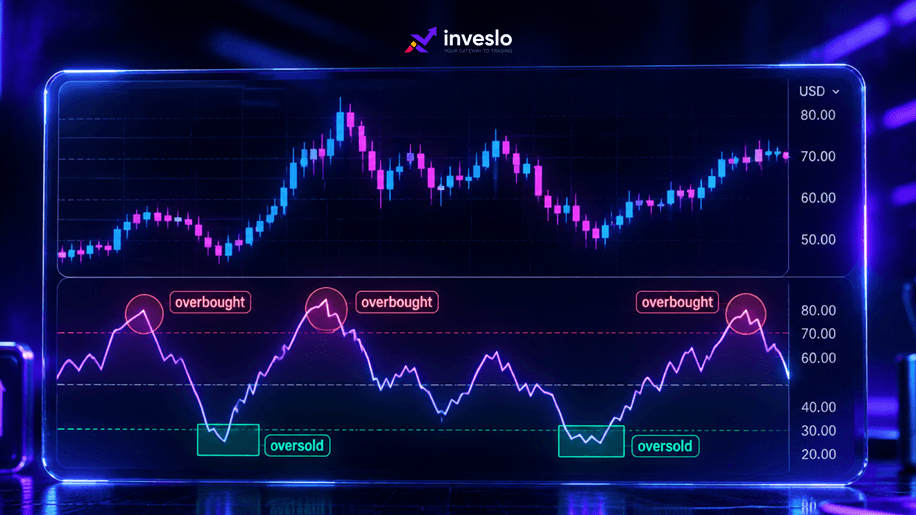
A price chart can show you where a market is moving, but it does not always make the strength of that move easy to judge. A market can continue rising while momentum starts to weaken, or price can fall sharply without immediately reversing.
The RSI indicator, or Relative Strength Index, gives traders another way to examine that momentum.
RSI is a momentum oscillator that moves between 0 and 100. Traders commonly use it to identify potentially overbought or oversold conditions, assess momentum, and look for divergence between price and the indicator.
The important part is knowing what those readings actually mean. An RSI above 70 does not automatically mean "sell," and an RSI below 30 does not automatically mean "buy."
What is RSI Indicator?
The Relative Strength Index (RSI) is a technical indicator developed by J. Welles Wilder Jr. It measures the speed and magnitude of recent price movements on a scale from 0 to 100.
The standard RSI setting uses 14 periods, although traders can change the period depending on their strategy and timeframe. TradingView lists 14 bars as its default RSI length.
In simple terms, RSI helps answer:
Is recent upward or downward price momentum becoming unusually strong?
Because RSI is bounded between 0 and 100, traders can compare readings consistently across charts.
How Does RSI Work?
RSI compares the size of recent gains with recent losses over the selected calculation period.
The indicator then converts that relationship into a value between 0 and 100.
A higher RSI generally means recent upward price movement has been stronger relative to recent downward movement. A lower RSI indicates stronger recent downward movement.
The standard interpretation uses:
RSI Reading | Common Interpretation |
Above 70 | Overbought |
50 | Midpoint / momentum reference |
Below 30 | Oversold |
The 70 and 30 levels come from Wilder's traditional interpretation. Some traders adjust these levels depending on the market and trading conditions.
What Does Overbought RSI Mean?
An RSI above 70 is traditionally described as overbought.
This means recent upward momentum has been strong enough to push RSI into an elevated range. It does not mean that the price must fall immediately.
This distinction matters because RSI can remain above 70 during a strong uptrend. A trader who sells simply because RSI crosses 70 may end up trading against a market that continues to rise. Fidelity specifically notes that RSI can remain in overbought or oversold territory for extended periods during strong trends.
Instead of treating 70 as an automatic sell signal, traders can ask:
Is the market trending or ranging?
Is price approaching a major resistance area?
Is RSI starting to fall after reaching an extreme?
Is there a divergence between price and RSI?
These additional factors provide more context.
What Does Oversold RSI Mean?
An RSI below 30 is traditionally described as oversold.
It indicates that recent downward price movement has been strong relative to recent upward movement.
Again, oversold does not automatically mean that price will rise.
In a strong downtrend, RSI can remain below 30 for an extended period. TradingView also notes that traders may adjust the traditional 70/30 levels based on their approach and market conditions.
An oversold reading is therefore better treated as a condition to investigate rather than an automatic buy signal.
What is the RSI 50 Level?
The 50 level sits in the middle of the RSI range and can provide additional context.
An RSI above 50 generally indicates that recent upward momentum is stronger than recent downward momentum. An RSI below 50 indicates the opposite.
Some traders use the 50 level as a simple momentum filter.
For example, a trader looking for long setups might prefer price structures supported by an RSI above 50, while a trader looking for short setups may look for RSI below 50.
The 50 level should still be considered alongside price action rather than used as a standalone entry rule.
What is RSI Divergence?
RSI divergence occurs when price and the RSI indicator move in different directions.
It can provide an early warning that momentum may be changing, although it does not guarantee a reversal. TradingView identifies two common forms: bullish and bearish RSI divergence.
Bullish RSI Divergence
Bullish divergence occurs when:
Price makes a lower low, while RSI makes a higher low.
Price is still moving lower, but the RSI is showing stronger momentum than it did at the previous low.
Traders may interpret this as a sign that downward momentum is weakening.
It does not confirm that the price will reverse. Traders often wait for additional price confirmation before acting.
Bearish RSI Divergence
Bearish divergence occurs when:
Price makes a higher high, while RSI makes a lower high.
Price has reached a new high, but RSI has failed to reach a corresponding high.
This can indicate weakening upward momentum.
Again, divergence is a signal to examine rather than a guaranteed reversal pattern.
How to Use RSI in a Trading Strategy
RSI can be used in several ways, but a practical approach is to combine it with the price structure already visible on the chart.
1. Identify the market context
First determine whether price is trending or moving within a range.
RSI behaves differently in strong trends than it does in sideways markets. An overbought reading during a strong uptrend can remain elevated for some time.
2. Check the RSI level
Look at whether RSI is above 70, below 30, or around the 50 midpoint.
The reading gives you information about recent momentum, rather than a guaranteed future direction.
3. Look for price confirmation
Instead of entering solely because RSI reaches an extreme, look for a relevant price structure.
For example, an RSI oversold reading near established support may provide more context than an oversold reading in the middle of a strong downtrend.
4. Check for divergence
Compare recent price highs or lows with RSI highs or lows.
A divergence can show that momentum is moving differently from price and may deserve closer attention.
5. Define the trade before entering
RSI should not replace basic risk management.
Before entering, determine where the trade idea becomes invalid and how much of the account you are prepared to risk.
RSI Trading Strategy: A Simple Example
Consider a market declining toward a known support area. Using the default 14-period RSI, the reading falls below 30, signalling oversold conditions. Instead of buying immediately, the trader waits.
Price reaches support and starts to stabilize, perhaps forming a higher low or a rejection candle. RSI then moves back above 30.
Now the trader can assess whether price action offers enough confirmation. Some traders also look for bullish divergence, where price makes a lower low but RSI makes a higher low.
RSI is one part of the decision. Trend context, support, price structure, timeframe and risk management still matter, and oversold readings can persist in strong downtrends.
Why RSI Can Give False Signals
RSI is useful, but it has limitations.
The most common mistake is assuming that overbought means price must fall and oversold means price must rise.
Strong trends can keep RSI at extreme levels for extended periods.
Divergence can also appear before price actually reverses. A bearish divergence, for example, can form while price continues higher.
Market conditions also matter. An RSI setup that works well in a range may behave differently during a strong trend.
For that reason, traders often combine RSI with price structure, support and resistance, or another method of assessing trend conditions. Charles Schwab, for example, describes using ADX to assess trend strength alongside RSI when studying momentum and overbought or oversold conditions.
Common RSI Trading Mistakes
Treating 70 as an automatic sell signal
An RSI above 70 indicates strong recent momentum. It does not tell you that the trend has ended.
Treating 30 as an automatic buy signal
Oversold conditions can persist during a falling market.
Ignoring the trend
RSI readings make more sense when viewed alongside the broader price structure.
Trading divergence without confirmation
Divergence can indicate weakening momentum, but it does not confirm that a reversal will occur.
Changing RSI settings without a reason
The standard 14-period setting provides a useful starting point. Changing the period changes the sensitivity of the indicator, so traders should understand why they are making that adjustment.
RSI vs Price Action: Which Should You Follow?
RSI and price action provide different information.
Price action shows what the market has actually done. RSI helps describe the momentum behind recent price movement.
A useful workflow is to start with price structure, then use RSI as supporting information.
For example:
Price structure → Trend or range → RSI momentum → Confirmation → Risk management
This keeps the indicator in its proper role rather than allowing one reading to determine the entire trade.
RSI for Forex and CFD Trading
RSI can be applied to many markets because it is calculated from price data rather than being limited to one asset class.
Forex traders may use it on major, minor, or exotic currency pairs. CFD traders can also apply it to instruments such as metals and indices.
Inveslo currently provides forex pairs, spot metals, spot indices, spot energies, and other instruments through MT4 and MT5. Its platform pages also list technical charting capabilities within its MT4 and MT5 offering.
How to Read RSI More Effectively
The RSI indicator is simple to add to a chart, but reading it well requires more than memorising 70 and 30.
Start by asking what the market is doing. Then examine the RSI level, compare momentum with price, and wait for confirmation that fits your trading plan.
Used this way, RSI can help traders understand momentum without turning every overbought or oversold reading into an automatic trade.
If you want to apply RSI to forex, metals, indices, or other available instruments, Inveslo provides MT4 and MT5 trading platforms where traders can use technical indicators as part of their market analysis.
FAQs About the RSI Indicator
What is the best RSI setting?
The standard RSI setting is 14 periods. There is no single setting that works for every market or trading style. Traders can adjust the period, but changing it also changes how quickly RSI responds to price movements.
What does RSI above 70 mean?
An RSI above 70 is traditionally considered overbought. It indicates strong recent upward momentum, but it does not automatically mean price will reverse.
What does RSI below 30 mean?
An RSI below 30 is traditionally considered oversold. It indicates strong recent downward momentum, but price can remain oversold during a strong downtrend.
What is bullish RSI divergence?
Bullish RSI divergence occurs when price makes a lower low while RSI makes a higher low. It can indicate weakening downward momentum.
What is bearish RSI divergence?
Bearish RSI divergence occurs when price makes a higher high while RSI makes a lower high. It can indicate weakening upward momentum.
Related articles
 ForexInveslo
What is the MACD Indicator? How to Spot Trend Reversals and Momentum
A price chart can show that a market is moving, but it does not always make it easy to judge whether momentum is strengthening or weakening...
 ForexInveslo
What is the Consumer Price Index (CPI)?
The Consumer Price Index (CPI) tracks the average change over time in prices consumers pay for a representative basket of goods and services. It is one of the main measures used to monitor consumer inflation.
 ForexInveslo
What is a Trading Journal & How Do Traders Use It?
A trader can remember a big winner for months and forget three poorly planned trades from the same week. That is one reason relying on memory makes trade review difficult.