
Most traders drown in indicators before they've ever learned to read a chart. Price action trading cuts through that, focusing on what the market is actually doing rather than what a calculated average thinks it might do. This guide covers the core mechanics, the most reliable patterns, and how to build a real strategy around raw price movement. And whether you're trading forex, indices, or commodities, the principles apply directly.
What is Price Action Trading?
Price action trading is the practice of making trading decisions based solely on historical price data, without relying on lagging technical indicators like RSI or MACD. You read the raw movement of price on a chart: highs, lows, candlestick formations, and the structure of how price has behaved over time.
The core idea isn't complicated. Price reflects everything the market knows at any given moment. Economic releases, institutional orders, retail sentiment - all of it gets digested and expressed as a single number on your screen. So if you can read that movement clearly, you don't necessarily need a layer of calculated averages sitting on top of it.
That's not to say indicators are useless. Many experienced traders use them as confirmation, a way to check that the story the candles are telling matches what a moving average or momentum reading suggests. But price action gives you the signal first, before the indicator has time to catch up.
How Does Price Action Trading Work?
The foundation sits on two concepts: support and resistance levels, and what candlesticks do when price reaches them.
Support is a price level where buying pressure has historically been strong enough to stop a decline in its tracks. Resistance works the other way, a level where sellers have consistently pushed price back down before it could break higher. These aren't magic lines. They're areas where the balance of supply and demand has visibly shifted before, which gives traders a reason to pay attention when price returns.
Here's how a basic price action read works in practice:
- Identify the trend. Is price making higher highs and higher lows (uptrend), or lower highs and lower lows (downtrend)? The trend is your context for every decision.
- Mark key levels. Find significant support and resistance zones on a higher timeframe, such as the daily or 4-hour chart.
- Wait for price to reach a level. Don't anticipate. Let the market come to your zone.
- Look for a candlestick signal. A rejection candle, an engulfing pattern, or a pin bar (explained below) near your level gives you a reason to act.
- Manage the trade. Set your stop-loss, an order that closes the trade automatically at a defined loss level, below the level you identified, and define your target before entering.
Practical tip: Always identify your stop-loss placement before entering. If the math doesn't work - if the risk is too large relative to the potential reward - skip the trade.
Key Price Action Patterns You Need to Know
Price action patterns are recurring formations in candlestick charts that signal potential reversals or continuations. A handful of them account for the majority of genuinely high-probability setups, and learning to identify those few well is far more useful than memorising a full encyclopedia of formations.
1. Pin Bar
A pin bar (short for Pinocchio bar) has a small body and a long wick, or shadow, extending in one direction. The long wick tells you the market rejected a price level hard and fast. A bearish pin bar at resistance suggests sellers stepped in with real force. At support, the bullish version tells the opposite story, buyers absorbed the move and pushed back.
2. Engulfing Candle
A bullish engulfing pattern forms when a green candle's body completely covers the previous red candle's body. It signals a shift in momentum, a point where buyers overwhelmed the sellers who had just been in control. The bearish version works in reverse. Both patterns are most meaningful when they appear at a clearly defined level, not mid-range on a directionless chart.
3. Inside Bar
An inside bar forms when the entire range of one candle fits within the high and low of the previous candle. Tight. Contained. It signals consolidation and often precedes a breakout, with traders watching for price to breach either boundary with conviction before committing to a direction.
|
Pattern |
Signal |
Best Used At |
Risk Note |
|
Pin Bar |
Reversal |
Support/Resistance levels |
False signals in choppy markets |
|
Engulfing Candle |
Momentum shift |
End of a clear trend move |
Requires level confluence |
|
Inside Bar |
Consolidation/Breakout |
Any trending market |
Direction uncertain until breakout |
|
Fakey (False Break) |
Trap reversal |
Key levels around inside bars |
Needs clean structure to validate |
Building a Price Action Trading Strategy
A price action trading strategy needs three things to be tradeable: a clear market structure read, a defined entry trigger, and a pre-set risk management rule. Miss any one of them and you're not following a strategy, you're improvising.
Market structure tells you whether the trend supports the trade direction. If you're looking to buy, you want to see price making higher lows overall. Buying against a clear downtrend because you spotted a pin bar is a low-probability approach, regardless of how clean the candle looks in isolation.
Entry triggers are the candlestick patterns covered above. But context carries more weight than the pattern itself. A pin bar sitting at a major daily level is a very different proposition from the same pattern appearing on a random 5-minute chart with no supporting structure around it.
Risk management is non-negotiable. Your risk per trade should be a fixed percentage of your account, typically between 0.5% and 2%, regardless of how confident you feel about any individual setup. Poor position sizing and inconsistent use of stop-losses are among the most common reasons retail traders give back gains.
Some brokers now offer tools that help traders structure entries around these principles. Inveslo, for example, provides detailed charting and execution tools designed to support technical analysis-based approaches like this one, which can be useful when you're learning to apply price action rules consistently.
Price Action in Forex: What Makes It Different?
Price action forex trading carries some nuances that don't apply in quite the same way to stocks or futures.
The forex market runs 24 hours a day, five days a week. That continuous flow creates deep liquidity (meaning assets can be bought or sold without significantly moving the price) in major pairs like EUR/USD or GBP/USD, which tends to make price action signals more reliable in those markets than in thinly traded pairs where a single large order can distort everything.
Session timing matters too, and it's something a lot of newer traders overlook entirely. Price action setups that form during the London or New York sessions, when volume is highest, tend to follow through more cleanly than those forming during the quiet Asian session. A pin bar that appears at 3 AM GMT on EUR/USD deserves considerably more scepticism than the same signal forming at the London open with proper volume behind it.
Major news events are a separate issue. They can overwhelm clean price structure entirely, turning a textbook setup into a chaotic spike in either direction. Many price action traders simply step aside during high-impact releases like US Non-Farm Payrolls or central bank rate decisions, waiting for the volatility to settle before trusting what the chart is showing them.
Risks and Limitations of Price Action Trading
Price action is not a system that removes uncertainty. It reduces noise. That's different.
Subjectivity is the core challenge, and it's one worth being honest about. Two experienced traders can look at the same chart and read the structure differently. What counts as a "clean" level or a "valid" pin bar involves judgment that only develops with real screen time, not from reading articles like this one.
Over-trading is another common failure mode. Because price action relies on pattern recognition, beginners tend to see setups everywhere, particularly when they're eager to be in the market. Waiting for genuine confluence, the alignment of trend, level, and signal, is what separates a disciplined approach from educated guesswork. Not every candlestick pattern is a setup worth taking.
Backtesting your specific rules on historical data is the most practical way to build confidence before risking real capital. Most trading platforms provide enough charting history to do this manually, and it's worth the time before you commit real money to a setup you haven't properly stress-tested.
Conclusion
Price action trading gives you a direct read on market behaviour by focusing on what price is actually doing rather than what derived indicators calculate. Applied consistently with proper risk management, it forms a solid foundation for any trading approach.
- Support and resistance: identify key levels on higher timeframes before looking for entry signals.
- Pattern confluence: a setup gains validity when trend, level, and candlestick signal align together.
- Risk per trade: fix your position size at 0.5% to 2% of account capital per trade, always.
- Session awareness: in forex, price action signals carry more weight during high-volume sessions.
Study your charts on demo before trading live. Pattern recognition takes repetition, not shortcuts.
FAQs
Q1. Is price action trading suitable for beginners?
A. Yes, it can be a strong starting point because it teaches you to read market structure before adding indicators. That said, beginners should expect a significant learning curve. Start on a demo account and focus on one or two patterns before expanding your toolkit.
Q2. What timeframes work best for price action trading?
A. Higher timeframes, particularly the daily and 4-hour charts, produce cleaner and more reliable signals. Lower timeframes like the 15-minute chart create more noise and false signals, making them better suited to experienced traders who already have a higher-timeframe bias established.
Q3. Can price action trading be used alongside indicators?
A. Absolutely. Many traders use a moving average to define trend direction, then apply price action patterns as entry signals. The key is ensuring the indicator informs your context, not your entry trigger. Let price action confirm the trade.
Q4. How do I know if a price action setup is valid?
A. A valid setup typically requires three things: the trade direction aligns with the prevailing trend, price has reached a clearly identified support or resistance level, and a recognised candlestick pattern has formed at that level with clear rejection visible on the candle.
Related articles
 ForexInveslo
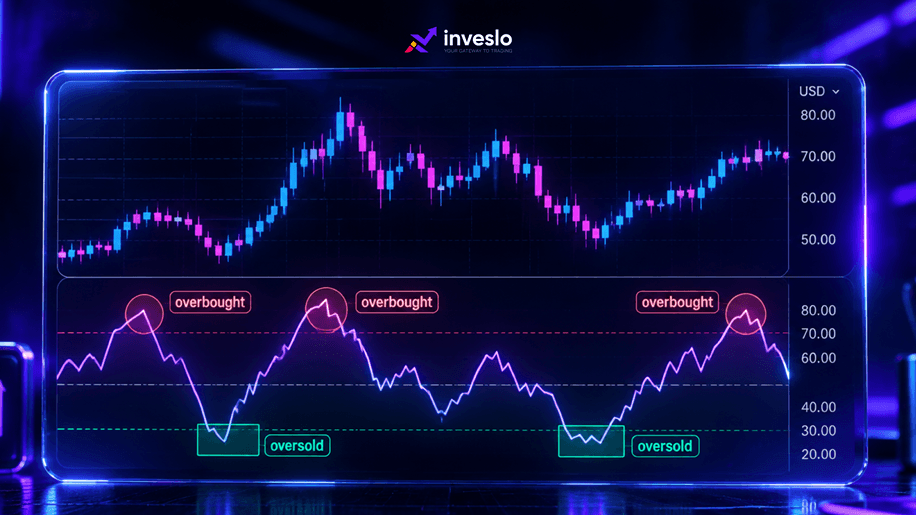
What is RSI Indicator? Overbought, Oversold, and How to Trade It
A price chart can show you where a market is moving, but it does not always make the strength of that move easy to judge. A market can continue rising while momentum starts to weaken..
 ForexInveslo
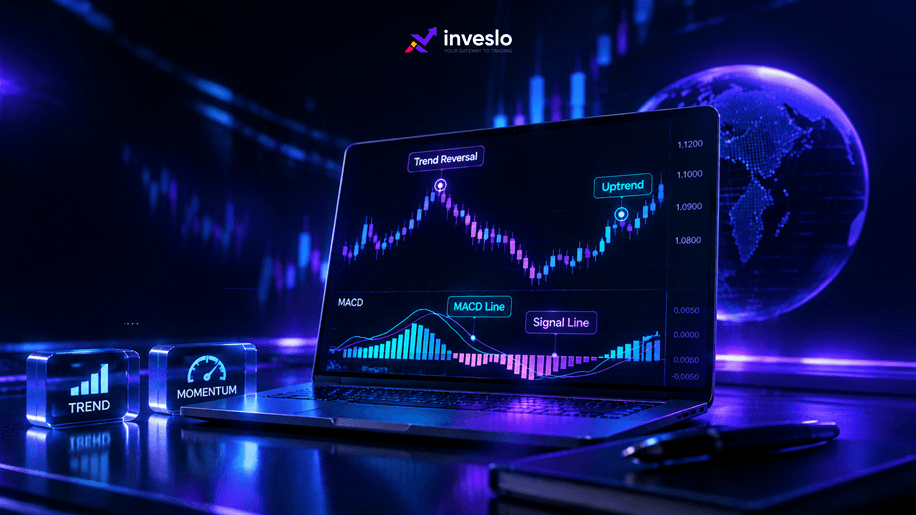
What is the MACD Indicator? How to Spot Trend Reversals and Momentum
A price chart can show that a market is moving, but it does not always make it easy to judge whether momentum is strengthening or weakening...
 ForexInveslo
What is the Consumer Price Index (CPI)?
The Consumer Price Index (CPI) tracks the average change over time in prices consumers pay for a representative basket of goods and services. It is one of the main measures used to monitor consumer inflation.