USD/JPY Price Analysis: Stumbles below 134.00 and the 200-DMA on soft USD
- The USD/JPY retraced from daily highs of 120 pips, as the USD is being offered.
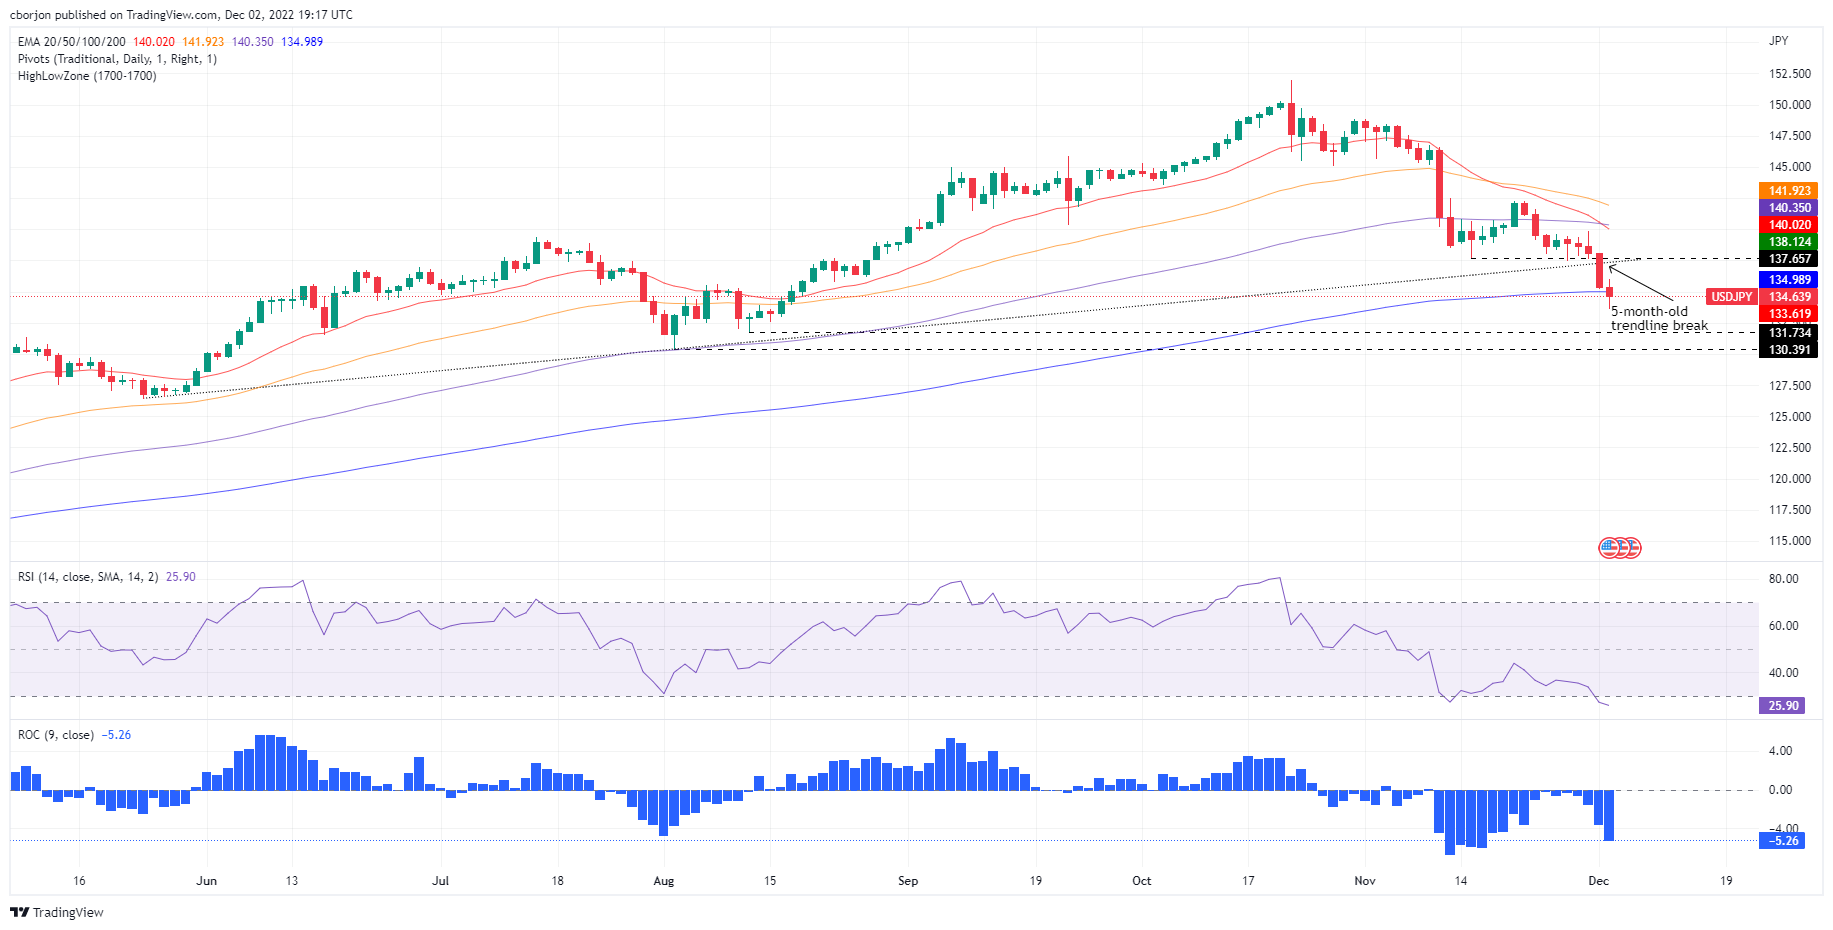
- USD/JPY: Daily close below the 200-DMA opens the door for a drop to 131.70s.
The US Dollar (USD) gave away its earlier gains courtesy of upbeat economic data revealed in the United States (US) and dropped 0.52% against the Japanese Yen (JPY). At the time of writing, the USD/JPY is trading at 134.63, below the 200-day Exponential Moving Average (EMA), as the JPY gets ready to finish the week with gains of 3.26%.
USD/JPY Price Analysis: Technical outlook
The USD/JPY daily chart portrays the pair as downward biased after breaking the 200-day EMA and a five-month-old upslope support trendline. Nevertheless, upbeat US data exacerbated a rally toward Friday’s high of 135.98. However, the Relative Strength Index (RSI) at bearish territory and the Rate of Change (RoC) aiming lower showed that sellers were gathering momentum. Eventually, the USD/JPY erased those gains and some more.
If the USD/JPY achieves a daily close below the 200-day EMA at 134.99, it could pave the way for further downside action. The USD/JPY key support levels would be the psychological 134.00 figure. A breach of the latter could open the door for a 220 pip drop towards the August 11 low at 131.73, followed by August’s low at 130.39.
USD/JPY Key Technical Levels
Forex News
Keep up with the financial markets, know what's happening and what is affecting the markets with our latest market updates. Analyze market movers, trends and build your trading strategies accordingly.